Only 3 out of the 100 trials resulted in “All Varsity.”
Conclusions
In the simulation, only 3 out of 100 were “All Varsity.”
While 3% is only a small chance, it is not impossible. It looks pretty suspicious.
Is 3% a small enough chance to make a formal accusation?
What Can Go Wrong?
Don’t Overstate Your Case
Simulation is not reality, it only indicates probability.
Model Outcome Chances Accurately
What would be wrong with generating random numbers 0, 1, 2, 3 to indicate the number of team members that room together?
There is not a 25% chance of each. They are not equally likely.
Run Enough Trials
Don’t just do a few trials. Err on the side of a large number of trials.
Chapter 11
Sample Surveys (11.1, 11.2, 11.3, 11.7)
11.1
The Three Big Ideas of Sampling
Idea 1: Examine a Part of the Whole
The Goal
Learn about the entire group of individuals (called the population)
The Problem
It is usually impossible to collect data on the entire population.
The Compromise
Collect data on a smaller group of individuals (called a sample) selected from the population.
Examples of Samples
People
Telephone surveys
Internet surveys
Data from a select group of customers
Student surveys handed out in class
Medical studies
Experimental units
Biological research
Crash dummy tests
Weather studies
Bias
The Challenge
Obtain a sample that is perfectly representative of the population.
Avoid bias – over or under emphasizing some characteristic of the population that is pertinent to the study.
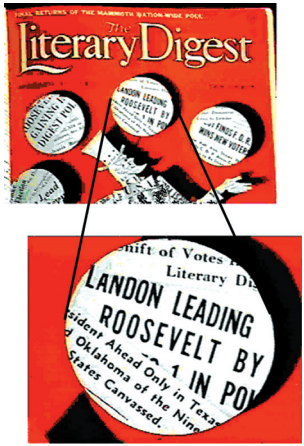
1936: Landon Beats Roosevelt??
The Survey
1936, Literary Digest received 2.4 million “mail in” ballots.
Used names from the phone book
The Results
Landon leads 57% to 43%
The Problem
Only high income earners could afford a phone.
This was a very biased survey.
Literary Digest soon went out of business.
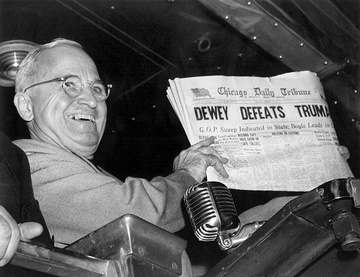
1948: Dewey defeats Truman??
2016: Clinton defeats Trump??
Idea 2: Randomize
Can we list the characteristics of the population and ensure we represent them all without bias?
Race, age, ethnicity, income, marital status, work type, family size, …
The list would go on forever. There are more types of people than the number of people.
So… what can we do???
Randomizing can lead to a representative sample.
Randomizing protects us from the influences of all the features of the population.
On average, the sample will look like the population.
Idea 3: It’s the Sample Size
If you need 100 students to get a random sample at the university, how many Americans would you need to achieve the same level of randomness from the entire U.S.A.?
Answer: 100
It is the number of individuals, not the percent of individuals that matters.
The number of individuals in the sample is called the sample size.
Census
Why not just include everyone?
Surveying everyone is called a census.
That would be best if we could.
Problems with a census
Very expensive
Takes too long
Usually impossible to find everyone
Not everyone is willing to participate.
The population is always changing – births and deaths occur every day.
Issues with a Census
Double Counting
College students are often counted both at their colleges and where their parents live.
Under Counting: Who is likely to be missed?
The poor
Undocumented immigrants
Homeless
Should we use sampling instead of a census?
Statisticians think so!
Politicians don’t agree.
11.2
Populations and Parameters
Parameter and Statistic
Based on a study a report stated that 21.7% of all U.S. teens do not wear seatbelts.
Do they really know about all U.S. teens?
They used the sample proportion to make inferences about the population proportion.
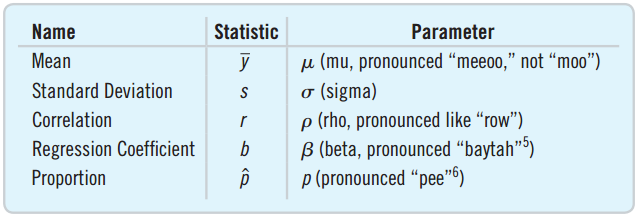
A parameter is a number used in a model of the population.
A statistic is a number that is calculated from the sample data.
Greek for Parameter, Latin for Statistic
Examples of parameters
\(\mu\), \(\sigma\), \(p\), \(\rho\), \(\beta\)
Examples of Statistics
\(\bar{y}\), \(s\), \(\hat{p}\), \(r\), \(b\)
Notice that \(\pi\) would be confusing as a parameter.
Representative Sampling
Since we can’t take a true census, we want to compute statistics that reflect the parameters.
A sample that does the above is called a representative sample.
Biased samples tend to not be representative.
The statistic tends to be much higher or much lower than the parameter.
What’s Wrong with Each of the Following?
It is always better to take a census than draw a sample.
Stopping students outside of the cafeteria is a good way to find out about its quality of food.
To get the same level of precision that 100 students sampled from a university with 3000 students will have, you need to sample 1000 students from a university with 30,000 students.
What’s Wrong with Each of the Following?
The majority of the 12,357 students who answer a website poll clicked that they enjoyed doing statistics homework. Since the sample size is large, we can conclude that the majority of all students enjoy doing statistics homework.
The true percentage of all Statistics students who enjoy the homework is called a “population statistic.”
11.3
Simple Random Samples
Random But Not Representative
Random
Suppose there are 100 men and 100 women in a class. Flip a coin.
Heads: Choose the 100 men.
Tails: Choose the 100 women.
Every student has an equally likely chance of being chosen. Randomness was achieved.
This will not produce a representative sample.
Simple Random Sampling
SRS
Order the students from 1 to 40.
Use a computer to randomly select 20 numbers from 1 to 40.
Select the students with the chosen numbers.
Simple Random Sampling (SRS) is when every combination has an equally likely chance to be selected.
SRS is the standard against which all other sampling techniques are measured.
Statistical theory is based on SRS.
Sampling Variability
Samples will vary from one to the next.
The first sample of five students’ weight might average 131 pounds.
The second might average 138 pounds.
The sample to sample differences are called the sampling variability (or sampling error).
Natural
Not a problem
11.7
Common Sampling Mistakes, or How to Sample Badly
Mistake 1: Sample Volunteers
Voluntary Response Sample
Open the survey up to many, only a few respond.
Internet polls
Letters to Congress
“How are we doing?” cards
Sampling frame does not correspond to population.
Prone to bias
Only most opinionated respond.
Mistake 2: Sample Conveniently
In Convenience Sampling we sample only those who are convenient for us to sample.
Asking all of your Facebook friends.
Surveying at shopping malls to find how much people like shopping.
Asking people in a restaurant how often they eat out.
Convenience sampling is always biased.
More likely to get people like you.
“Safe-looking” people.
Mistake 2b: How psychological science works… sometimes
Psychological Science is based on Convenience Sampling: we often sample those who are convenient for us to sample (for surveys)
Students that see your announcement
Other graduate students
Labmates
Convenience sampling is always biased…
But in Psychology, results are extrapolated not only to the respective populations, but to all humanity…!
The WEIRD problem (Western, educated, and from industrialized, rich, and democratic countries)
Mistake 3: Use a Bad Sampling Frame
Complete sampling frames are difficult. In a phone survey you may miss:
People in prison
Homeless people
Students
Long-term travelers
Cell-phone users who like their privacy
Mistake 4: Undercoverage
Bias can result when a subpopulation is left out or underrepresented.
Evening telephone surveys
Door-to-door surveys
Surveys given in English
Nonresponse Bias
Nonresponse bias is a concern for most surveys.
It is better to put forth effort to ensure a smaller group responds than to put the survey out to a large number and only receive a small number of responses.
Consider whether nonrespondents are likely to think differently from responders.
?
Response Bias
Response bias is anything in the survey design that influences the responses.
People want to please the interviewer.
People don’t want to admit they are flawed.
People hide personal facts: income, age, etc.
Wording of the question can steer the response.
How to Think about Bias
Always look for bias.
If there is bias in a survey that you have already conducted, you must start over. A larger sample size won’t help.
Spend your time and resources reducing bias.
Who was excluded from the study?
Pilot-test the survey.
Look for misunderstandings, confusion, etc.
Refine your survey based on the pilot.
Always report the sampling method in detail.
Preview
Why do we talk about:
Simulation (the dorm lottery)
Sampling
Classical Statistical Testing is based on the idea of:
running a study on a representative sample → results A
“theoretically” repeating the study numerous times
obtaining a theoretical probability distribution
seeing how result A fares compared with the distribution
It’s like running a simulation
Chapter 12
Experiments and Observational Studies
12.1
Observational Studies
Music and Good Grades
The Study:
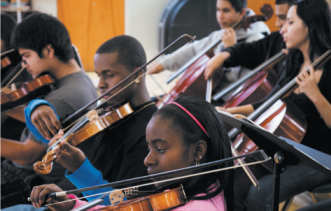
Compared GPAs of music students and non-music students at Mission Viejo High School.
The Results
Music Students: 3.59
Non-Music Students: 2.91
Conclusions
Should we make all students play an instrument?
Issues
Could there be something else resulting in both?
Observational Studies
Observational Studies
Researchers don’t assign choices.
Passively observe participants
Good for discovering relationships related to rare outcomes
Bad for establishing cause-and-effect relationships
Tough to handle lurking variables
Do musicians have more supportive parents that help GPA?
Retrospective Studies
Retrospective Studies
Collect data on something that has already occurred
Similar pros and cons as observational studies
Additional issues can include:
Unreliable memories
Incomplete historical records
Often limited to a small part of the population
Prospective Studies
A prospective study is a study where we identify subjects in advance and collect data as events unfold.
Pros:
Possible to isolate the variables.
With care, can establish cause and effect.
Can design the study to your specifications.
Cons:
Can be expensive.
Rare occurrences require very large samples.
Can take too long:
Do breast-fed babies live longer than bottle-fed?
Which kind of study?
Early 2007, many dogs and cats died of kidney failure. Should you conduct a retrospective or prospective study to find out why?
Retrospective Study
The event happened in the past.
It may have been a rare event.
The retrospective study may provide clues on the cause.
Once possible causes are identified, try a prospective study to verify the causes - if it doesn’t kill any pets.
12.2
Randomized, Comparative Experiments
Experiments
Is it possible to establish a cause and effect relationship?
Take 100 young children. Randomly select 50 to be in a music program. The other 50 will not be allowed to play an instrument.
An experiment requires random assignment of subjects to treatments.
Only experiments can establish cause and effect.
How Experiments Work
Identify the explanatory variable(s), called the factor(s).
Identify the response variable.
Select subjects or participants (if human) or experimental units (if not human).
Decide on the levels to choose for each factor.
Music program or no music program
Sleep hours: 4, 6, or 8
The combination of specific levels from all factors that a subject receives is called its treatment.
Assigning Participants to Treatments
Don’t let them choose.
Don’t assign based on what’s best for each.
Randomly assign participants into groups. Each group receives a different treatment.
Only through random assignment can a cause-and-effect relationship be established.
What ethical dilemmas might this introduce?
12.3
The Four Principles of Experimental Design
Control and Randomization
1. Control
Make all other conditions as similar as possible for all treatment groups.
Control allows us to isolate the one thing that is being studied. Helps avoid lurking variables
2. Randomize
Equalizes the effects of variation that we cannot control
Distributes the uncontrollable factors equally
Control what you can, randomize the rest.
Replicate and Block
Replicate
Apply each treatment to a number of subjects.
Repeat the entire experiment on an entirely different population of experimental units.
Block
Group similar individuals together and randomize within each of these blocks.
Blocking helps account for the variability due to the difference between blocks.
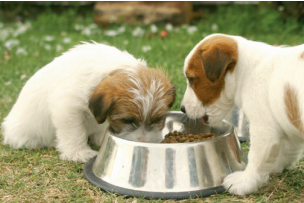
Is the Pet Food Safe?
Control
Food and water portions, housing, exercise, sleep. Stick to one breed.
Randomize
Assign dogs to two feed treatments randomly.
Replicate
Redo the entire experiment with a different breed.
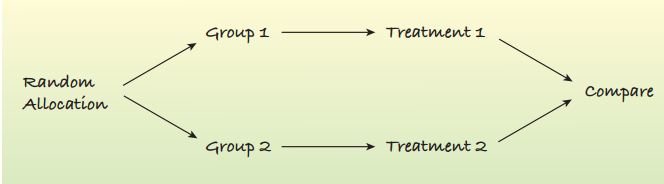
Diagrams
A diagram is a useful organizational tool.
Flow charts help to understand the process
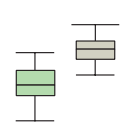
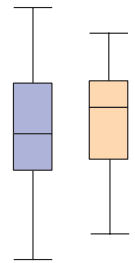
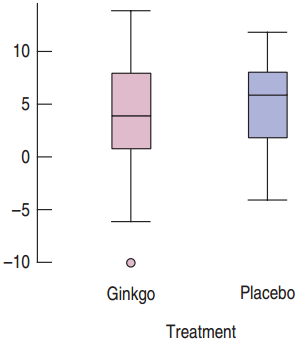
Side-by-side boxplots help compare the treatment groups.
Statistical Significance
A difference is called statistically significant if the difference is greater than what we would expect from random chance, if we’d repeat the test multiple times.
Flip a coin 100 times:
54 heads is not statistically significant since it would not be surprising to observe this outcome.
94 heads is statistically significant since it would be surprising to observe this outcome.
Statistical Significance
Statistically significant since the medians of each are outside the typical values of the other.
Not statistically significant since the medians of each are within the typical values of the other.
Random Samples and Random Treatments
Surveys use a random group of participants.
Experiments find a homogeneous group, separate them into random subgroups for treatment.
Experiments do not use a random sample from the population.
Beware of stating that the participants from the experiment represent the larger population.
12.4
Control Treatments
Control Groups and Control Treatments
Control
Does eating ten carrots a day help you lose weight?
Find 200 participants and randomly select 100 of them to eat ten carrots a day.
The other 100 are the control group.
Not eating ten carrots a day is the control treatment.
Blinding
What brand of cola is the best?
If you give participants cans of cola and ask how much they like it, the label can be an influence.
Instead give each an unlabeled cup of soda.
Single-blinding involves the participants not knowing whether they are in the control or treatment group.
If the person handing out the cups hands out her favorite soda she may bias the results.
Double-blinding means neither the participant nor the person handing out the soda knows the label.
Who Can Affect the Experiment
There are two main classes of individuals who can affect the experiment.
Those who can influence the results.
Subjects
Researchers
Treatment administrators
Technicians
Those who evaluate the results.
Judges
Treating Physicians
Placebos
A placebo is a “fake” treatment that looks like the treatment being tested.
Just telling a patient that they are being treated can aid recovery.
This is called the placebo effect. The placebo is fake but the placebo effect is real!
Use a placebo for effective blinding.
Placebo Effect Really is True
The Study
One group received Ginkgo, the other received a placebo.
13 memory tests were given.
Ginkgo better for 6 tests.
Placebo better for 7 tests.
Summary of Experimental Techniques
Randomized
Comparative
Double-blind
Placebo-controlled
12.5
Blocking
Comparing Nail Polish with Blocking
I want to compare two types of nail polish, red and nude, to see how much they are likely to get chipped
The right hand and the left hand might yield different results
Nail Polish
Comparing Nail Polish on Real Hands
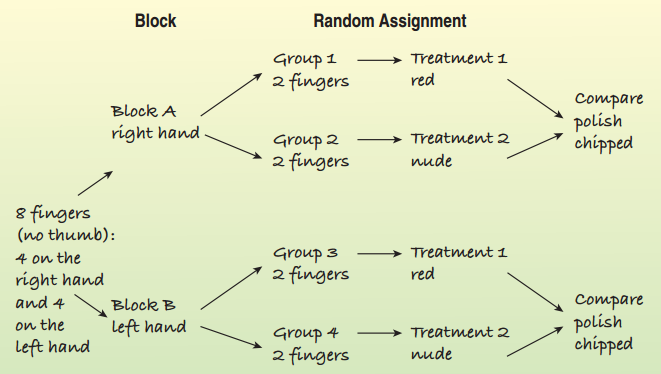
To decrease variation, randomly assign half the right hand fingers red and other half nude.
Do the same for the left hand side.
This ensures that a color is not overrepresented by the right hand.
Each hand serves as a separate experiment.
Blocking
Experimental units can be separated into groups that are not the treatment, we call these groups blocks.
Blocking involves randomly assigning the treatments within each block.
Blocking helps isolate the variability due to the differences between blocks.
Blocking helps clarify the difference between the treatments.
The design is called a randomized block design.
Chart of a Randomized Block Design
12.6
Confounding
Animated Teaching vs. Subdued Teaching
Professor Ceci taught the same course in the fall and the spring.
Fall: No slides, everything else the same
Spring: Slides
Results: How much did you learn? (1-5)
Fall: 2.93
Spring: 4.05
Conclusions
Slides better than no slides???
Weather: Fall ends gloomy, spring ends pleasant.
Confounding Factors
Two factors are confounded if the levels of one are associated with the levels of the other.
Weather and Professor Ceci’s style were confounded.
Try to avoid confounding factors, but it is difficult and sometimes impossible.
Avoiding confounding factors can introduce new ones.
Compare morning and afternoon fall courses.
Two Factors
A bank sent out 50,000 low-rate-no-fee offers and 50,000 high rate with fee offers.
Many more responses for low rate, no fee
Was it the low rate or no fee that customers liked?
Should have sent out four types of offers:
Low rate, no fee
Low rate, with fee
High rate, no fee
High rate, with fee
Lurking and Confounding
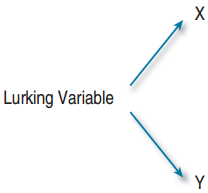
Lurking Variable
Associated with both \(x\) and \(y\)
Makes it appear that \(x\) causes \(y\)
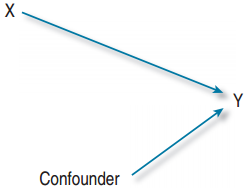
Confounding Variable
Associated in a noncausal way with a factor
Affects the response
Can’t tell if the cause was the factor or confounding variable
What Can Go Wrong?
Don’t give up just because you cannot run the experiment.
Sometimes we have to resort to an observational study. Do airbags lower the risk of dying?
Beware of Confounding
If possible, use randomization.
If not possible, report out likely confounding factors.
What Can Go Wrong? (Continued)
Bad things can happen even to good experiments.
Record additional information that may help in the analysis.
Don’t spend your entire budget on the first run.
Try a small pilot run first.
Then refine the factor levels and fix other problems.