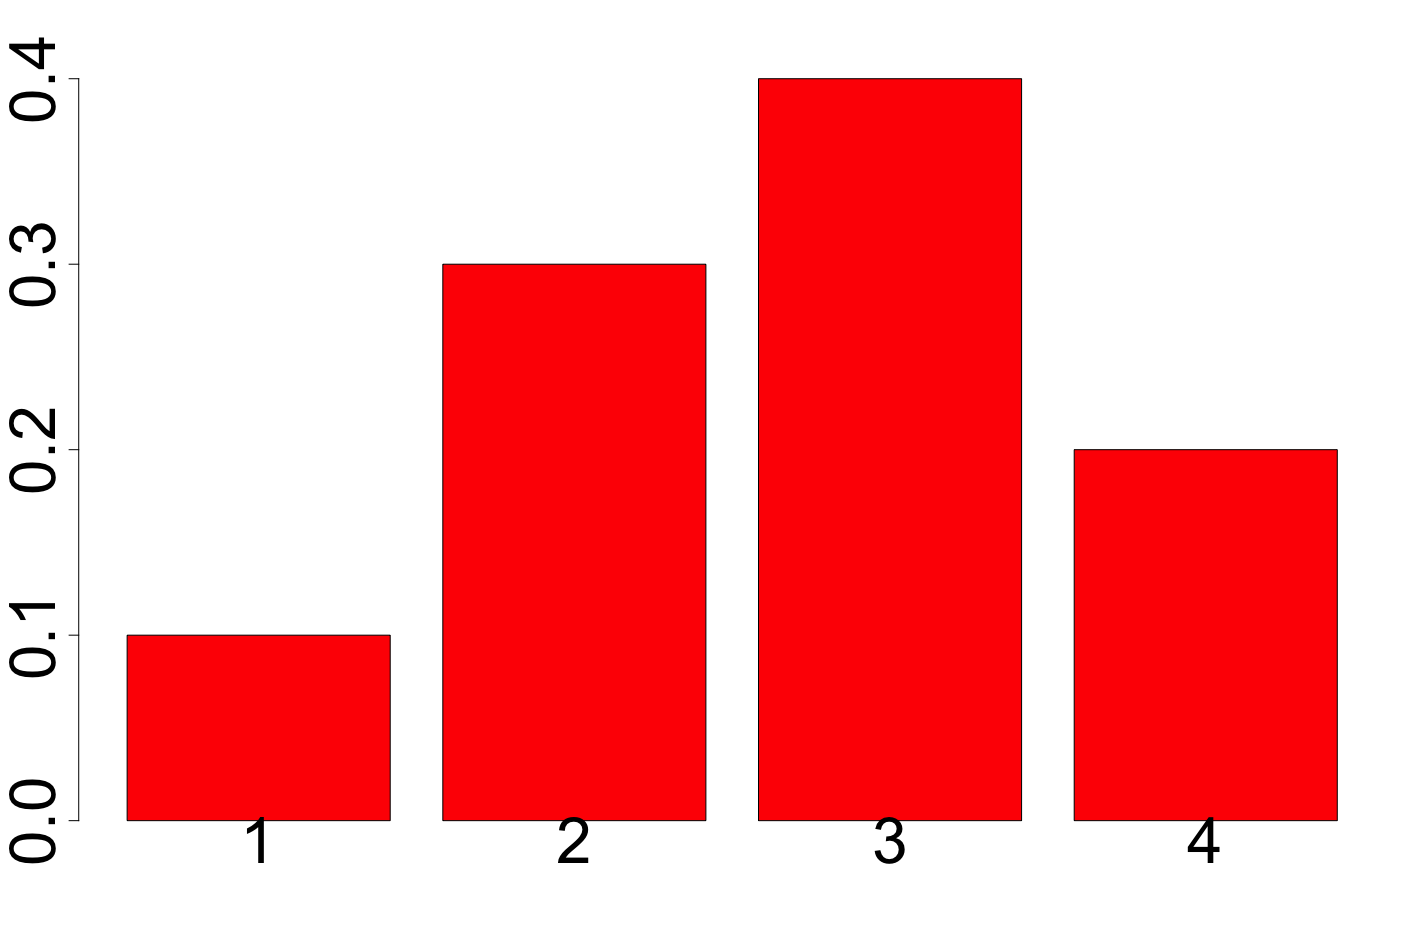
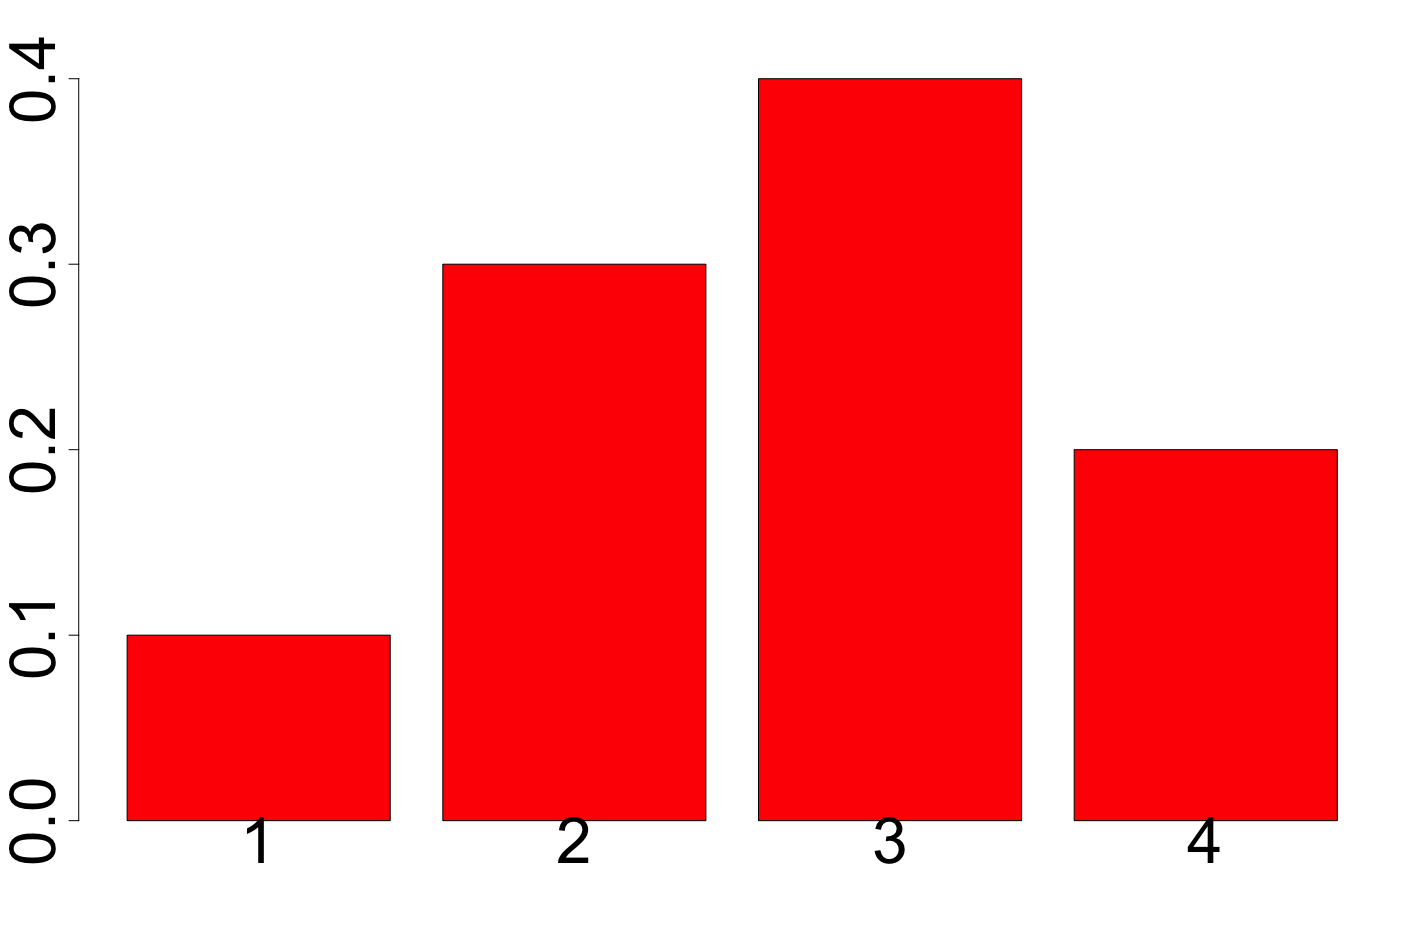
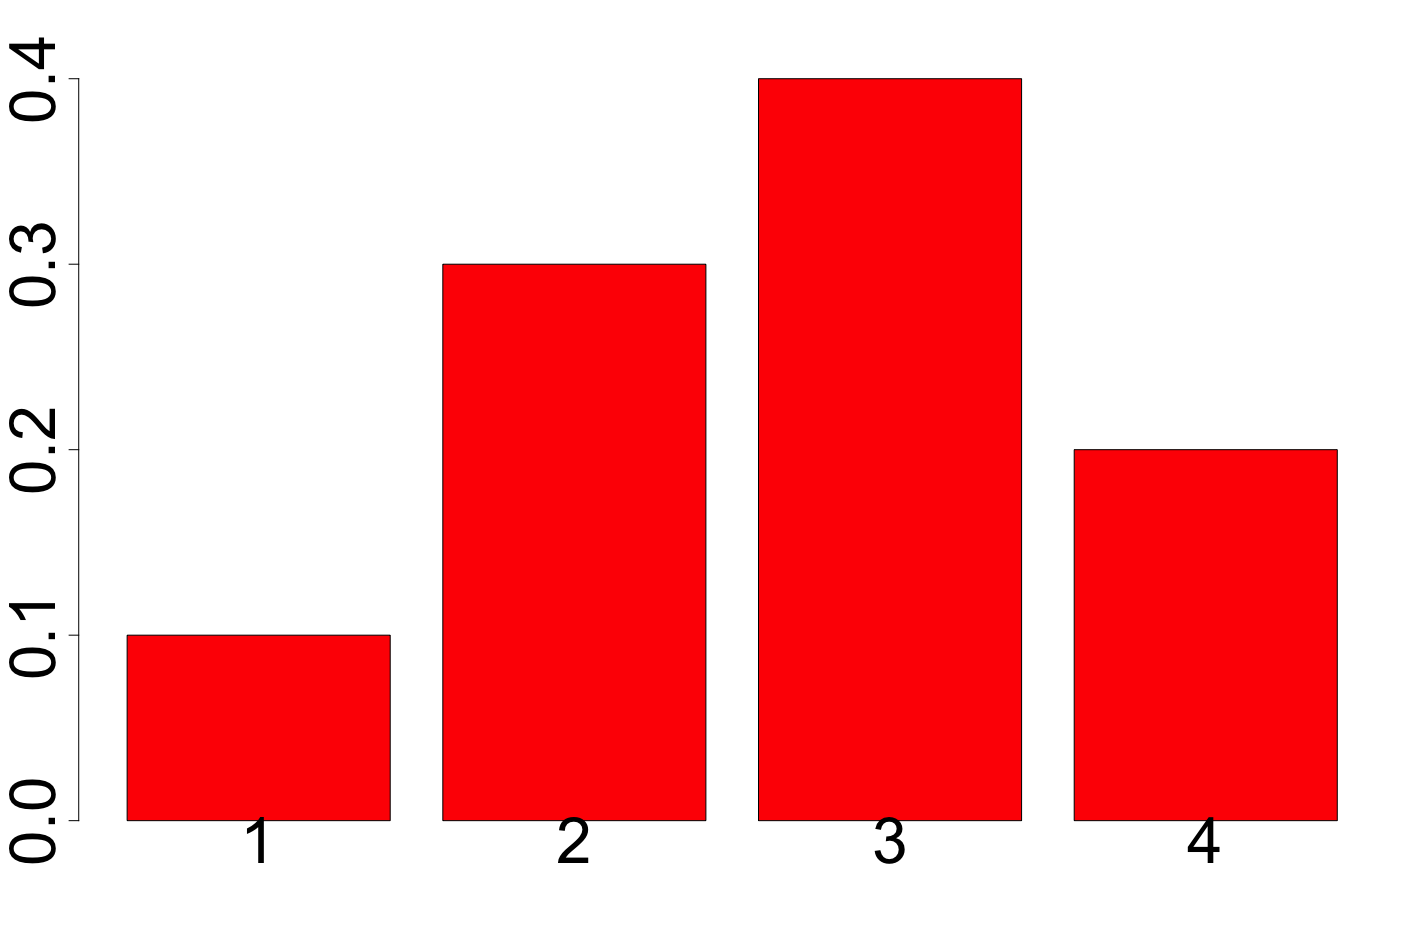
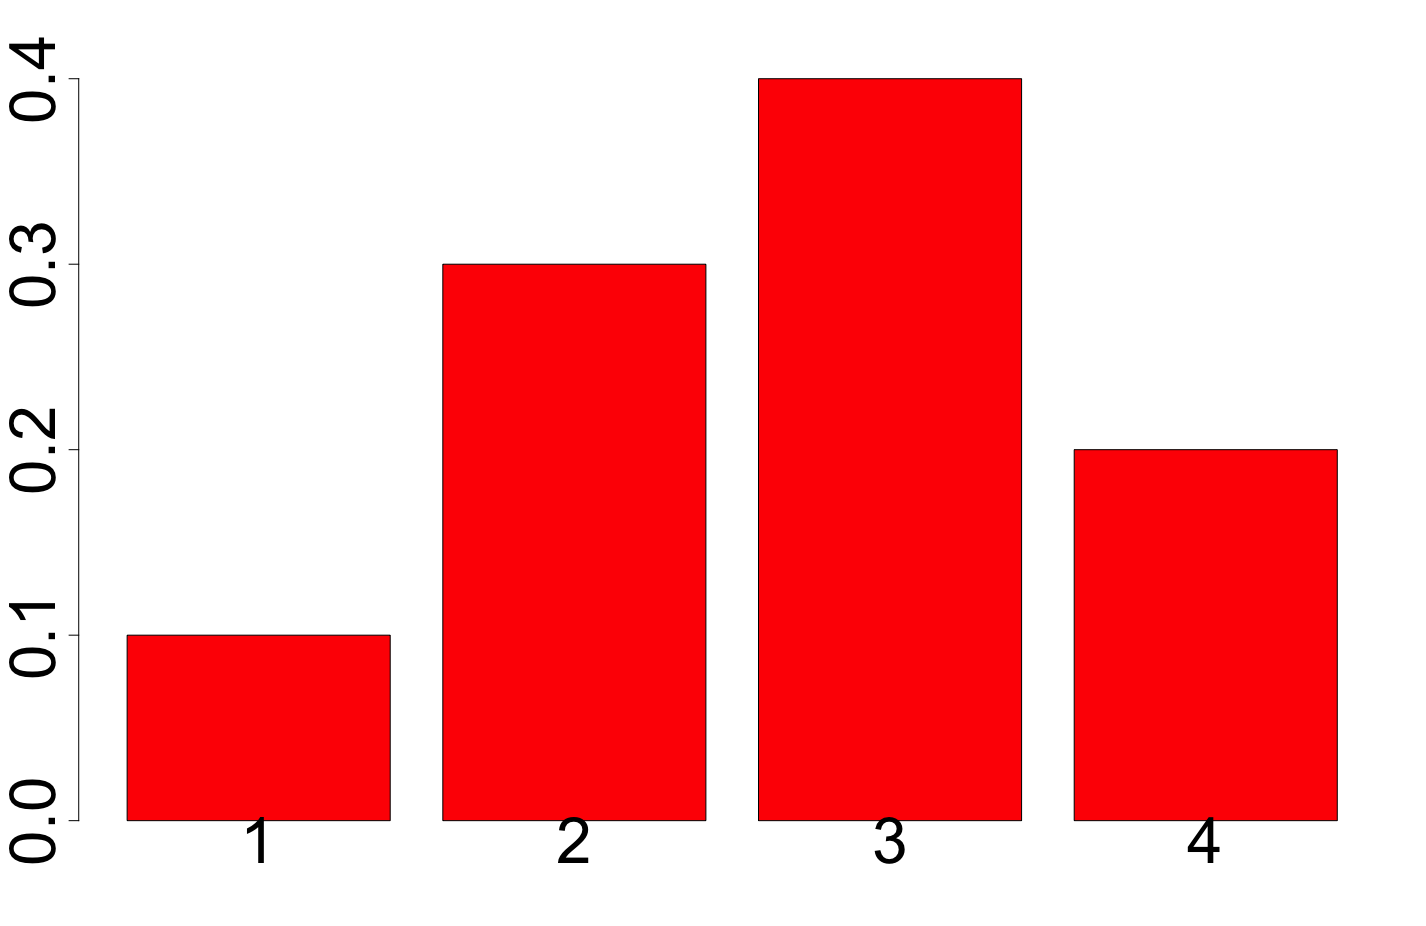
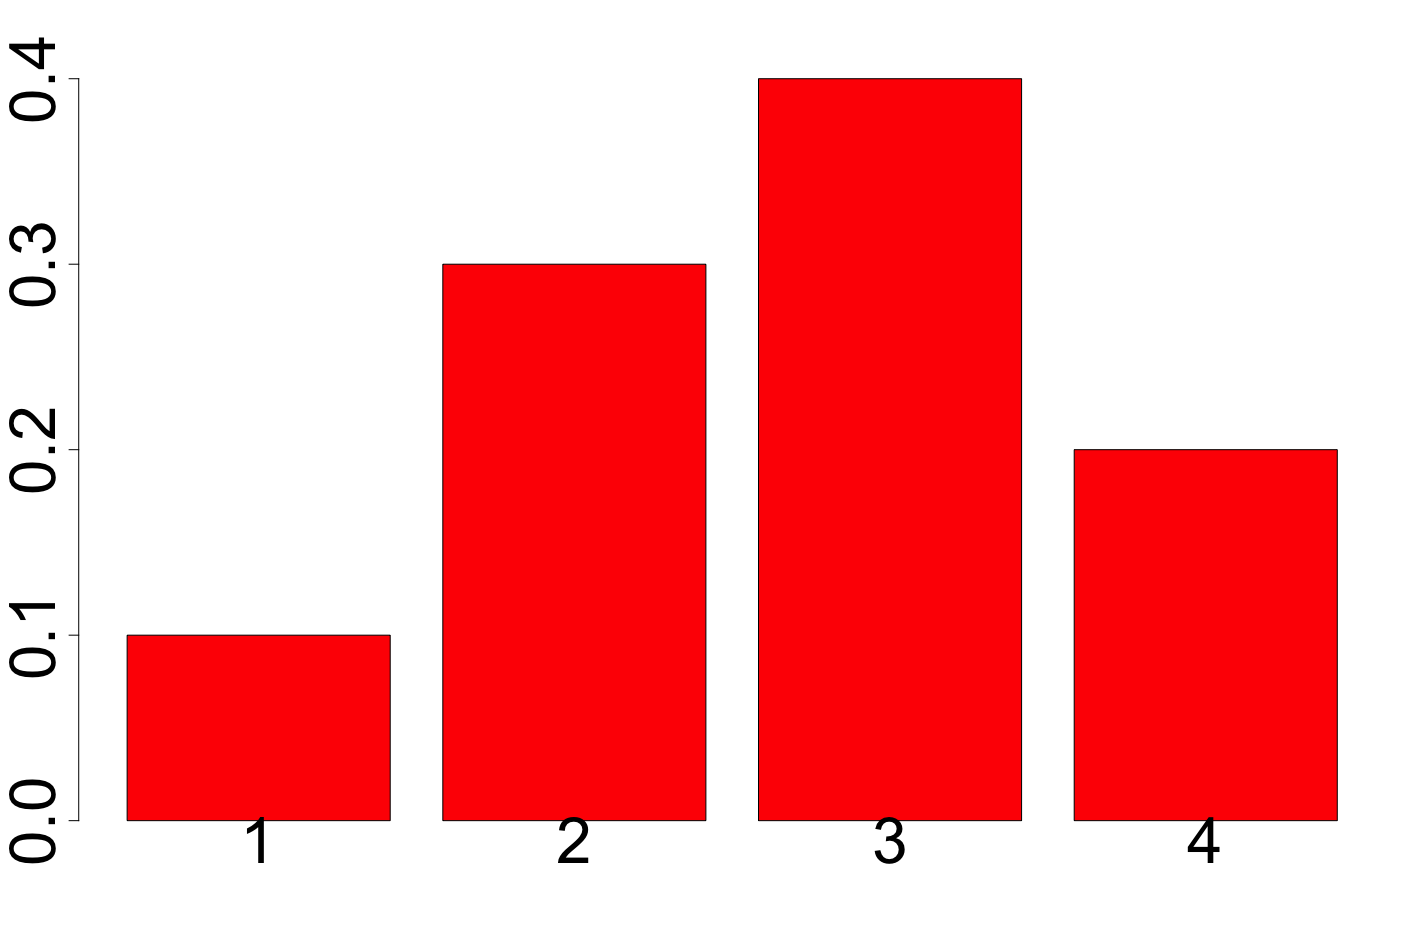
Now imagine that you roll the die 10 times obtaining:
{5,6,4,5,3,2,1,2,4,6}
The sample mean, for this specific sample, is 3.8.
Imagine that you take another sample; this time the mean is 3.4. You keep taking samples and calculating the mean; ultimately the mean of the means will converge to 3.5.
Continuous Random Variables
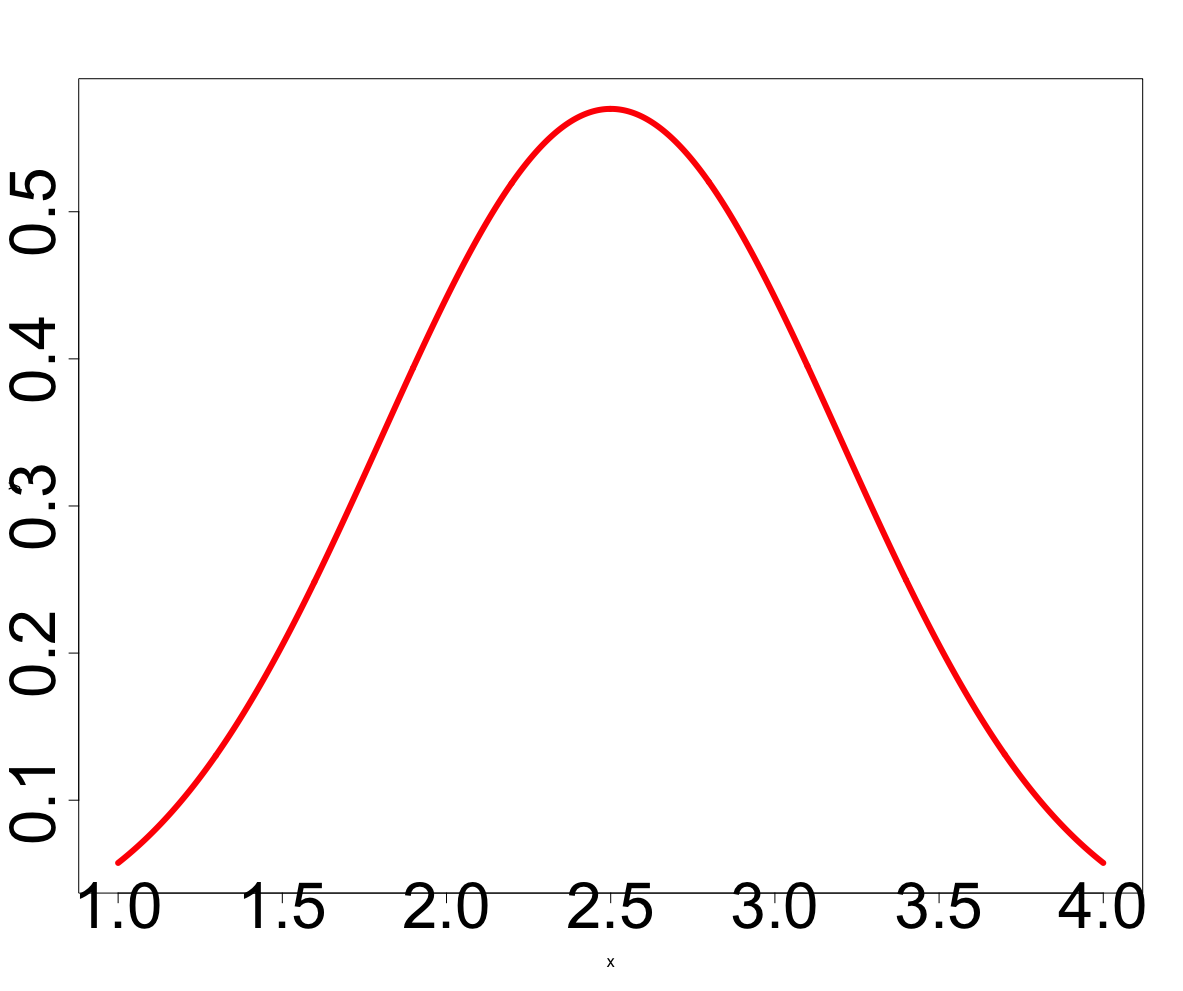
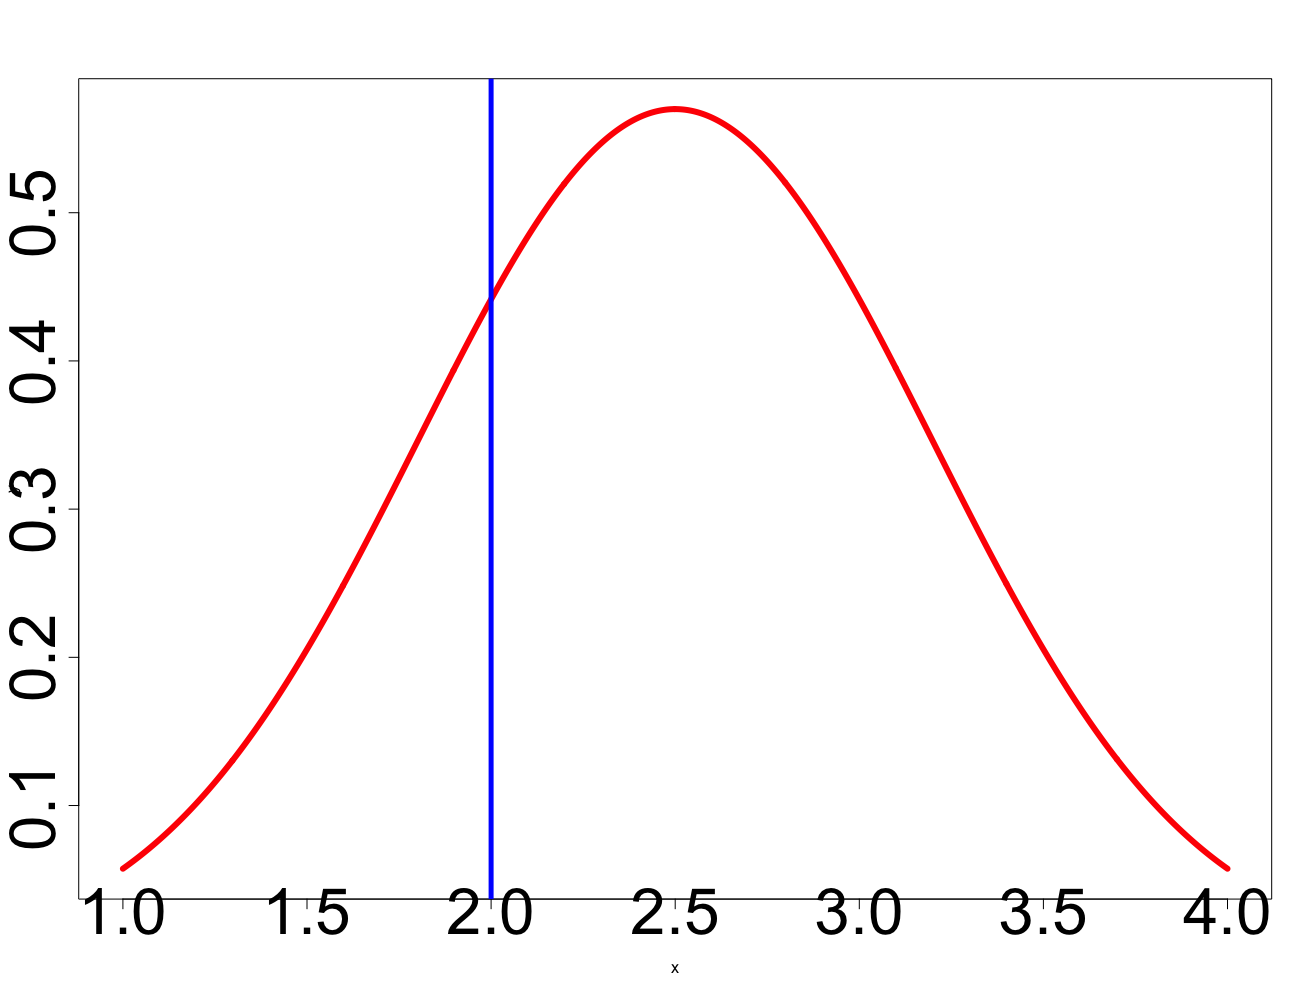
Random variables that can take on any value in a range of values are called continuous random variables.
x <-seq(1,4,length=1000)y <-dnorm(x,mean=2.5, sd=0.7)plot(x,y,type="l",lwd=6,cex.axis=4,col=("red"))
Chapter 16
Probability Models
Summary
Question: is my result likely? I need a model
How do we build a model for our data?
Random variable
→ Probability model (or probability distribution)
There are many different distributions we can define and use, discrete or continuous.
Examples:
Discrete: geometric or binomial
Continuous: normal, uniform, exponential
Focus on binomial and normal distributions
Before we look at distributions, we need to define a basic “experiment”, a Bernoulli trial
Continuous and Discrete Random Variables
Discrete
Continuous
Review: Bernoulli Trials
There are only two possible outcomes (called success and failure) on each trial.
The probability of success, denoted p, is the same on every trial.
The trials are independent. Obtaining a success in one trial does not influence the probability of obtaining a success in another trial.
Situations like this occur often and are called Bernoulli trials.
We saw two probability models for Bernoulli trials: the geometric model and the binomial model.
The Geometric Model
We want to model how long it will take to achieve the first success in a series of Bernoulli trials.
The model that tells us this probability is called the Geometric probability model.
Geometric Probability Model for Bernoulli Trials: GEOM(n, p)
p = probability of success
q = 1 – p = probability of failure
X = number of trials until the first success occurs
\[P(X = x) = q^{x-1}p\]
Expected value: \(E(X) = \mu = \dfrac{1}{p}\)
Standard deviation: \(\sigma = \sqrt{\dfrac{q}{p^2}}\)
The Binomial Model
A Binomial probability model describes the number of successes in a specified number of trials.
It takes two parameters to specify this model: the number of trials n and the probability of success p.
A binomial model can be used to model a survey answer, or any binary proportion
Binomial Probability Model for Bernoulli Trials: BINOM(n, p)
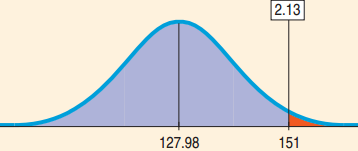
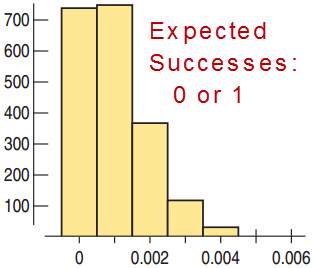
There is over a 98% chance that no more than 151 of them were real messages. The filter may be working.
Chapter 17
Sampling Distribution Models
17.1
Sampling Distribution of a Proportion
Sampling About Climate Change
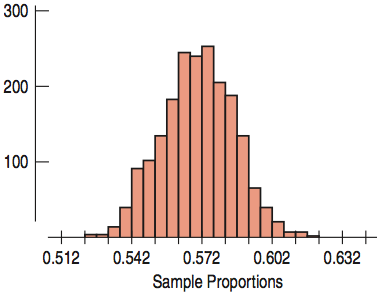
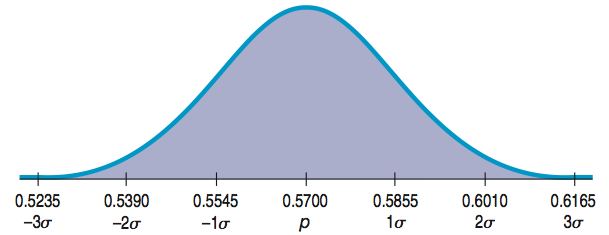
According to a Gallup poll of 1022 Americans, 57% believe that climate change is due to human activity.
If many surveys were done of 1022 Americans, we could calculate the sample proportion for each.
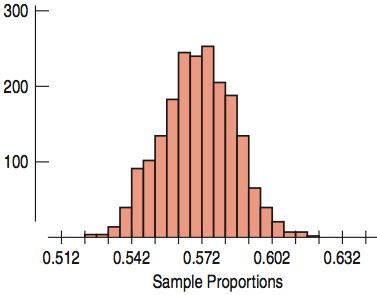
The histogram shows the distribution of a simulation of 2000 sample proportions.
The distribution of all possible sample proportions from samples with the same sample size is called the sampling distribution.
Sampling Distributions
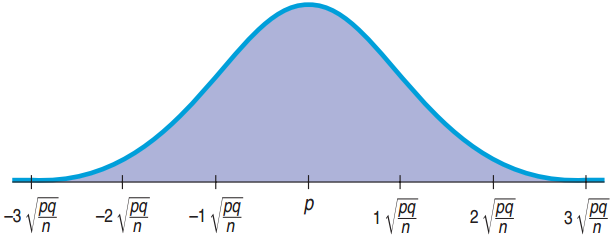
Sampling Distribution for Proportions
Symmetric
Unimodal
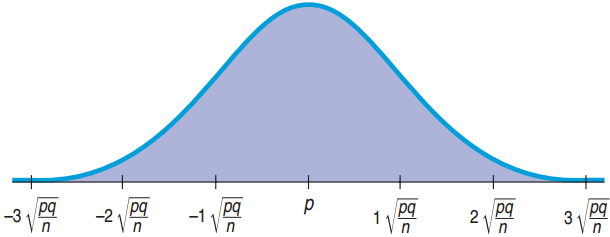
Centered at p
The sampling distribution follows the Normal model.
What does the sampling distribution tell us?
The sampling distribution allows us to make statements about where we think the corresponding population parameter is and how precise these statements are likely to be.
Sampling Distribution for Smoking
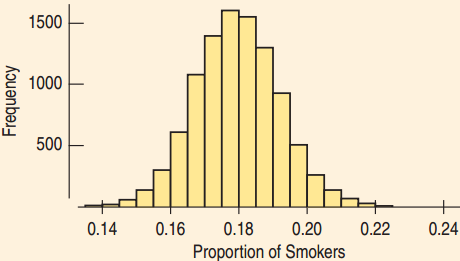
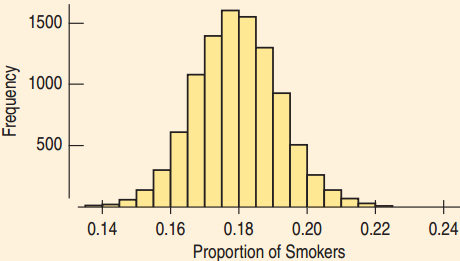
18% of US adults smoke. How much would we expect the proportion of smokers in a sample of size 1000 to vary from sample to sample?
We run a simulation
# from 1 to 100
# from 1 to 18: smokers
draw 10,000 samples of 1000
Histogram: simulation’s results
Sampling Distribution for Smoking
18% of US adults smoke. How much would we expect the proportion of smokers in a sample of size 1000 to vary from sample to sample?
We run a simulation
Histogram: simulation’s results
The mean is 0.18 = the population proportion.
The standard deviation was calculated as 0.0122.
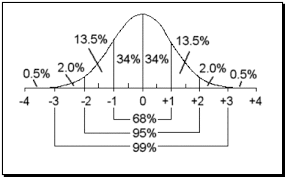
Roughly Normal: 68-95-99.7 rule works.
95% of all proportions are within 0.0244 of the mean.
This is very close to the value found: 95.41%
From One Sample to Many Samples
Distribution of One Sample
Variable was the answer to the survey question or the result of an experiment.
Proportion is a fixed value that comes from the one sample.
Sampling Distribution
Variable is the proportion that comes from the entire sample.
Many proportions that differ from one to another, each coming from a different sample.
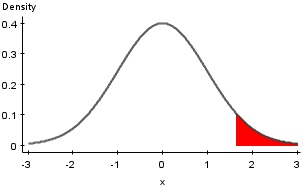
68-95-99.7 Rule: Values 2 SD below the mean occur less than 2.5% of the time. Perhaps this college has a higher proportion of healthy women, or women who lie about their weight.
Enough Lefty Seats?
13% of all people are left handed.
A 200-seat auditorium has 15 lefty seats.
What is the probability that there will not be enough lefty seats for a class of 90 students?
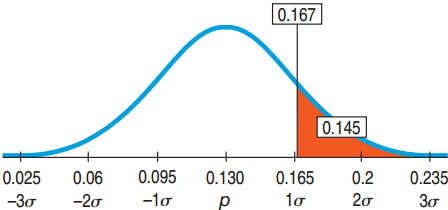
Plan: 15/90 ≈ 0.167, Want \(P(\hat{p} > 0.167)\)
Model:
Independence Assumption: With respect to lefties, the students are independent.
Conclusion: There is about a 14.5% chance that there will not be enough seats for the left handed students in the class.
17.3
The Sampling Distribution of Other Statistics
The Sampling Distribution for Others
There is a sampling distribution for any statistic, but the Normal model may not fit.
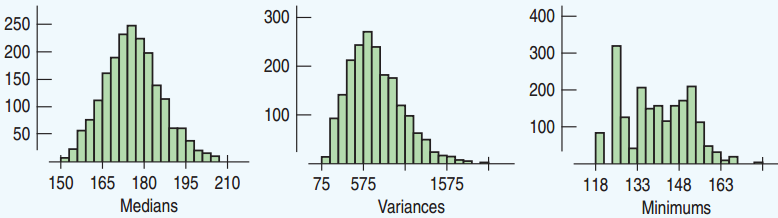
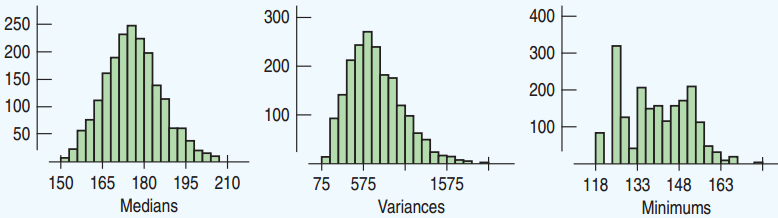
Below are histograms showing results of simulations of sampling distributions.
The Sampling Distribution For Others
The medians seem to be approximately Normal.
The variances seem somewhat skewed right.
The minimums are all over the place.
In this course, we will focus on the proportions and the means.
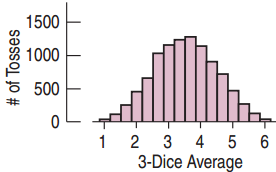
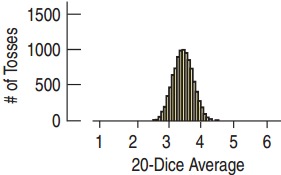
Sampling Distribution of the Means
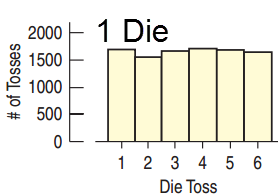
For 1 die, the distribution is Uniform.
For 3 dice, the sampling distribution for the means is closer to Normal.
For 20 dice, the sampling distribution for the means is very close to normal. The standard deviation is much smaller.
17.4
The Central Limit Theorem: The Fundamental Theorem of Statistics
The Central Limit Theorem (CLT)
The mean of a random sample
is a random variable
whose sampling distribution
can be approximated by a Normal model.
The larger the sample, the better the approximation will be.
The Central Limit Theorem (CLT)
The mean of a random sample
is a random variable
whose sampling distribution
can be approximated by a Normal model.
The larger the sample, the better the approximation will be.
The Central Limit Theorem (CLT)
The mean of a random sample
is a random variable
whose sampling distribution
can be approximated by a Normal model.
The larger the sample, the better the approximation will be.
The Central Limit Theorem (CLT)
The mean of a random sample
is a random variable
whose sampling distribution
can be approximated by a Normal model.
The larger the sample, the better the approximation will be.
The Central Limit Theorem (CLT)
The mean of a random sample
is a random variable
whose sampling distribution
can be approximated by a Normal model.
The larger the sample, the better the approximation will be.
The Central Limit Theorem (CLT)
The mean of a random sample
is a random variable
whose sampling distribution
can be approximated by a Normal model.
The larger the sample, the better the approximation will be.
The Central Limit Theorem
The Central Limit Theorem
The sampling distribution of any mean becomes nearly Normal as the sample size grows.
Requirements
Independent
Randomly collected sample
The sampling distribution of the means is close to Normal if either:
Large sample size
Population close to Normal
How Normal?
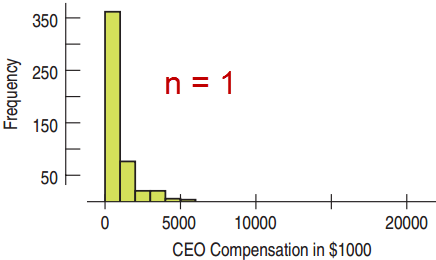
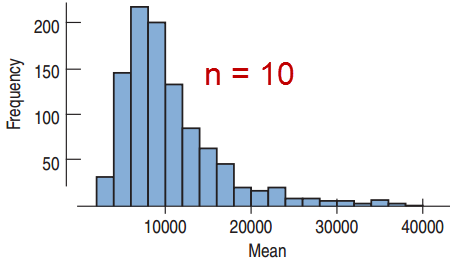
Population Distribution and Sampling Distribution of the Means
Population Distribution
Normal
Uniform
Bimodal
Skewed
Sampling Distribution for the Means
→ Normal (any sample size)
→ Normal (large sample size)
→ Normal (larger sample size)
→ Normal (larger sample size)
Binomial Distributions and the Central Limit Theorem
Consider a Bernoulli trial as quantitative:
Success = 1
Failure = 0
The mean of many trials is just \(\hat{p}\).
This distribution of a single trial is far from Normal.
By the Central Limit Theorem, the Binomial distribution is approximately normal for large sample sizes.
Standard Deviation of the Means
Which would be more unusual: a student who is 6’9” tall in the class or a class that has mean height of 6’9”?
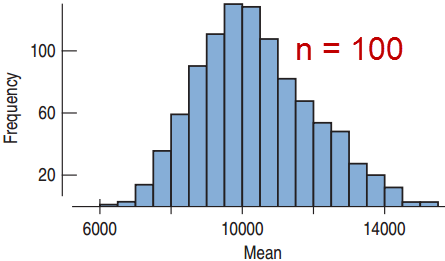
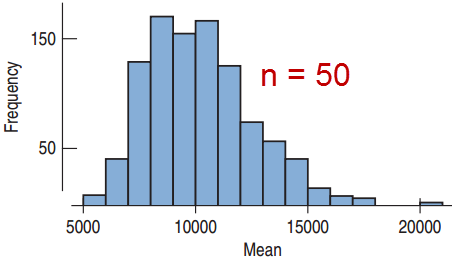
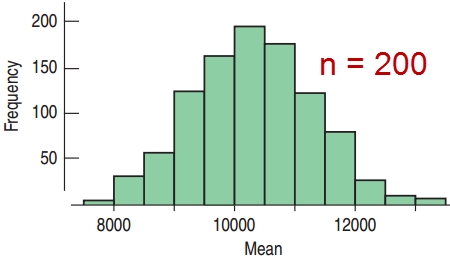
The sample means have a smaller standard deviation than the individuals.
The standard deviation of the sample means goes down by the square root of the sample size:
\[SD(\bar{y}) = \frac{\sigma}{\sqrt{n}}\]
The Sampling Distribution Model for a Mean
When a random sample is drawn from a population with mean \(\mu\) and standard deviation \(\sigma\), the sampling distribution has:
Mean: \(\mu\)
Standard Deviation: \(\dfrac{\sigma}{\sqrt{n}}\)
For large sample size, the distribution is approximately normal regardless of the population the random sample comes from.
The larger the sample size, the closer to Normal.
Low BMI Revisited
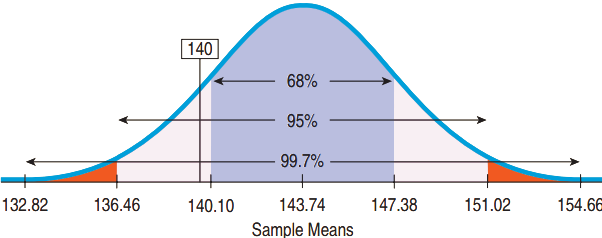
The 200 college women with the low BMI reported a mean weight of only 140 pounds. For all 18-year-old women, \(\mu\) = 143.74 and \(\sigma\) = 51.54. Does the mean weight seem exceptionally low?
Randomization Condition: The women were a random sample with weights independent.
Sample size Condition: Weights are approximately Normal. 200 is large enough.
Low BMI Revisited
Mean and Standard Deviation of the sampling distribution
The 68-95-99.7 rule suggests that the mean is low but not that unusual. Such variability is not extraordinary for samples of this size.
Too Heavy for the Elevator?
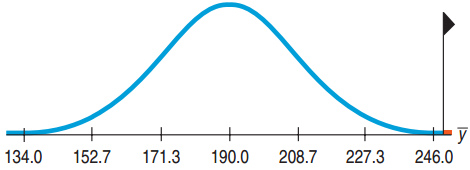
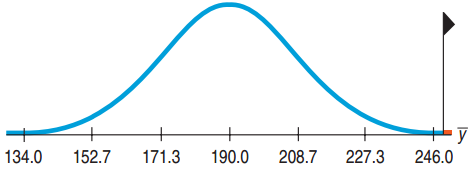
Mean weight of US men is 190 lb, the standard deviation is 59 lb. An elevator has a weight limit of 10 persons or 2500 lb. Find the probability that 10 men in the elevator will overload the weight limit.
Plan: 10 over 2500 lb same as their mean over 250.
Model:
Independence Assumption: Not random, but probably independent.
Sample Size Condition: Weight approx. Normal.
Too Heavy for the Elevator
Model:\(\mu\) = 190, \(\sigma\) = 59. By the CLT, the sampling distribution of \(\bar{y}\) is approximately Normal:
Multiply n by 4 → Divide the standard deviation by 2.
Need a sample size of 100 to reduce the standard deviation by a factor of 10.
Billion Dollar Misunderstanding
Bill and Melinda Gates Foundation found that 12% of the top 50 performing schools were from the smallest 3%. They funded a transformation to small schools.
Small schools have a smaller n, thus a higher standard deviation.
Likely to see both higher and lower means.
18% of the bottom 50 were also from the smallest 3%.
Distribution of the Sample vs. the Sampling Distribution
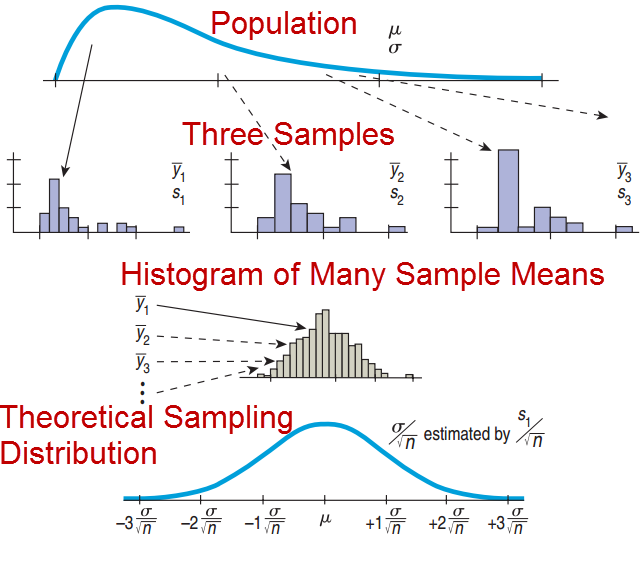
Don’t confuse the distribution of the sample and the sampling distribution.
If the population’s distribution is not Normal, then the sample’s distribution will not be normal even if the sample size is very large.
For large sample sizes, the sampling distribution, which is the distribution of all possible sample means from samples of that size, will be approximately Normal.
Two Truths About Sampling Distributions
Sampling distributions arise because samples vary. Each random sample will contain different cases and, so, a different value of the statistic.
Although we can always simulate a sampling distribution, the Central Limit Theorem saves us the trouble for proportions and means. This is especially important when we do not know the population’s distribution.
What Can Go Wrong?
Don’t confuse the sampling distribution with the distribution of the sample.
A histogram of the data shows the sample’s distribution. The sampling distribution is more theoretical.
Beware of observations that are not independent.
The CLT fails for dependent samples. A good survey design can ensure independence.
Watch out for small samples from skewed or bimodal populations.
The CLT requires large samples or a Normal population or both.
The sampling distribution is approximately normal.
Facebook: true population proportion?
A recent survey found that 48 of 156 or 30.8% update their Facebook status daily.
This is the sample proportion
What is the true population proportion?
To find it, we need to make an inference using the sampling distribution we just found, based on SE
Interpreting this Normal Curve
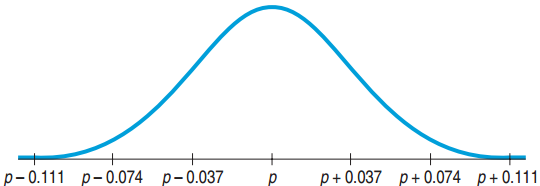
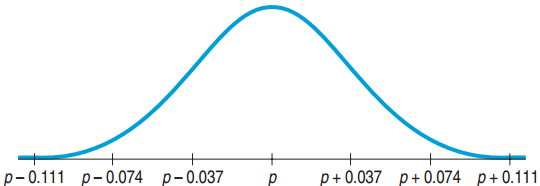
By normality, about 95% of all possible samples of 156 young Facebook users will have \(\hat{p}\)’s within 2 SE (0.037) of p
If \(\hat{p}\) is close to p, then p is close to \(\hat{p}\).
If you stand at \(\hat{p}\), then you can be 95% sure that p is within 2 SE’s from where you are standing.
→ Our confidence interval: (0.234, 0.382)
What You Can Say About p if You Know \(\hat{p}\)
We don’t know exactly what percent of all Facebook users update their status daily, but the interval from 23.4% and 38.2% probably contains the true proportion.
Note, we admit we are unsure about both the exact proportion and whether it is in the interval.
We are 95% confident that between 23.4% and 38.2% of all Facebook users update their status daily.
Notice “% confident” and an interval rather than an exact value are stated.
What You Cannot Say About p if You Know \(\hat{p}\)
30.8% of all Facebook users update their status daily.
We can’t make such absolute statements about p.
It is probably true that 30.8% of all Facebook users update their status daily.
We still cannot commit to a specific value for p, only a range.
We don’t know exactly what percent of all Facebook users update their status daily, but we know it is within the interval 30.8% ± 2 x 3.7%.
We cannot be certain it is in this interval.
Naming the Confidence Interval
This confidence interval is a one-proportion z-interval.
“One” since there is a single survey question.
“Proportion” since we are interested in the proportion of Facebook users who update their status daily.
“z-interval” since the distribution is approximately normal.
18.2
Interpreting Confidence Intervals: What Does 95% Confidence Really Mean?
Capturing a Proportion
The confidence interval may or may not contain the true population proportion.
Consider repeating the study over and over again, each time with the same sample size.
Each time we would get a different \(\hat{p}\).
From each \(\hat{p}\), a different confidence interval could be computed.
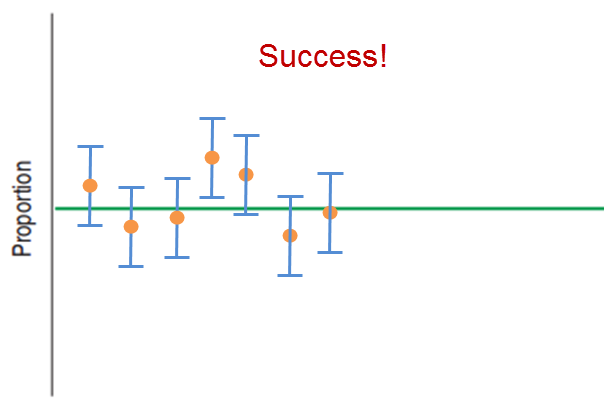
About 95% of these confidence intervals will capture the true proportion.
5% will not.
Simulating Confidence Intervals
Confidence Intervals
There are a huge number of confidence intervals that could be drawn.
In theory, all the confidence intervals could be listed.
95% will “work” (capture the true proportion).
5% will not capture the true proportion.
What about our confidence interval (0.234, 0.382)?
We will never know whether it captures the population proportion.
“Statistics Means Never Having to Say You Are Certain”
Facebook Status Updates
Technically Correct
I am 95% confident that the interval from 23.4% to 38.2% captures the true proportion of Facebook users who update daily.
More Casual But Fine
I am 95% confident that between 23.4% and 38.2% of Facebook users update daily.
18.3
Margin of Error: Certainty vs. Precision
Margin of Error
Confidence interval for a population proportion:
\[\hat{p} \pm 2SE(\hat{p})\]
The distance, \(2SE(\hat{p})\), from \(\hat{p}\) is called the margin of error.
Confidence intervals also work for means, regression slopes, and others. In general, the confidence interval has the form
\[\text{Estimate} \pm ME\]
Certainty vs. Precision
Instead of a 95% confidence interval, any percent can be used.
Increasing the confidence (e.g. 99%) increases the margin of error.
Decreasing the confidence (e.g. 90%) decreases the margin of error.
Confidence Interval on Global Warming
Yale and George Mason University interviewed 1010 US adults about beliefs and attitudes on global warming. They presented a 95% confidence interval on the proportion who think there is disagreement among scientists.
Had the polling been done repeatedly, 95% of all random samples would yield confidence intervals that contain the true population proportion of all US adults who believe there is disagreement among scientists.
Yale/George Mason Study Revisited
The poll of 1010 adults reported a margin of error of 3%.
(by convention, 95% with “worst case” ME based on p = 0.5)
z*: the critical value that specifies the number of SE’s needed for C% of random samples to yield confidence intervals that capture the population proportion.
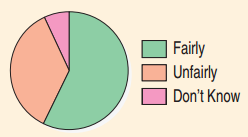
Do You Believe the Death Penalty is Applied Fairly?
Sample size: 510
Answers:
58% “Fairly”
36% “Unfairly”
7% “Don’t Know”
Construct a confidence interval for the population proportion that would reply “Fairly.”
Do You Believe the Death Penalty is Applied Fairly?
Plan: Find a 95% confidence interval for the population proportion.
Model:
Randomization: Randomly selected by Gallup Poll
10% Condition: Population is all Americans
Success/Failure Condition
(510)(0.58) = 296 > 10, (510)(0.42) = 214 > 10
Use the Normal Model to find a one-proportion z-interval.
Do You Believe the Death Penalty is Applied Fairly?
The test mailing should include at least 19,112 offers.
What Can Go Wrong?
Don’t claim other samples will agree with yours.
Wrong: In 95% of samples, between 43% and 51% agree with decriminalization of marijuana.
Don’t be certain about the parameter.
Wrong: Between 23% and 38% of Facebook users update daily. Don’t forget to include the confidence.
Don’t forget that it’s about the parameter (not the statistics)
Wrong: I’m 95% confident that \(\hat{p}\) is between 23% and 38%. You know for sure exactly what \(\hat{p}\) is.
What Can Go Wrong?
Don’t claim to know too much.
Wrong: I’m 95% confident that between 23% and 38% of all Facebook users in the world update daily. The survey was just about US residents between 18 and 22.
Do take responsibility.
Accept that you are only 95% confident, not sure.
Don’t suggest that the parameter varies.
Wrong: There is a 95% chance that the true parameter is between 23% and 38%.
What Can Go Wrong?
Do treat the whole interval equally.
The middle of the interval is not necessarily more plausible than the edges.
Beware of margins of error that are too large to be useful.
Between 10% and 90% update daily is not useful. Use a larger sample size to shrink the ME.
Watch out for biased sampling.
Biased samples produce unreliable CIs.
Think about independence
Be careful in your sample design to ensure randomization.