Quantitative Methods
Serena DeStefani – Lecture 12 – 7/28/2020
How did we get here?
- Two questions:
- What’s the population parameter?
- Is my result likely?
- To answer these questions I need a probability model
- The rules of probability
- Random variable: the Bernoulli trial
- The geometric and binomial distribution
- The normal approximation to the binomial
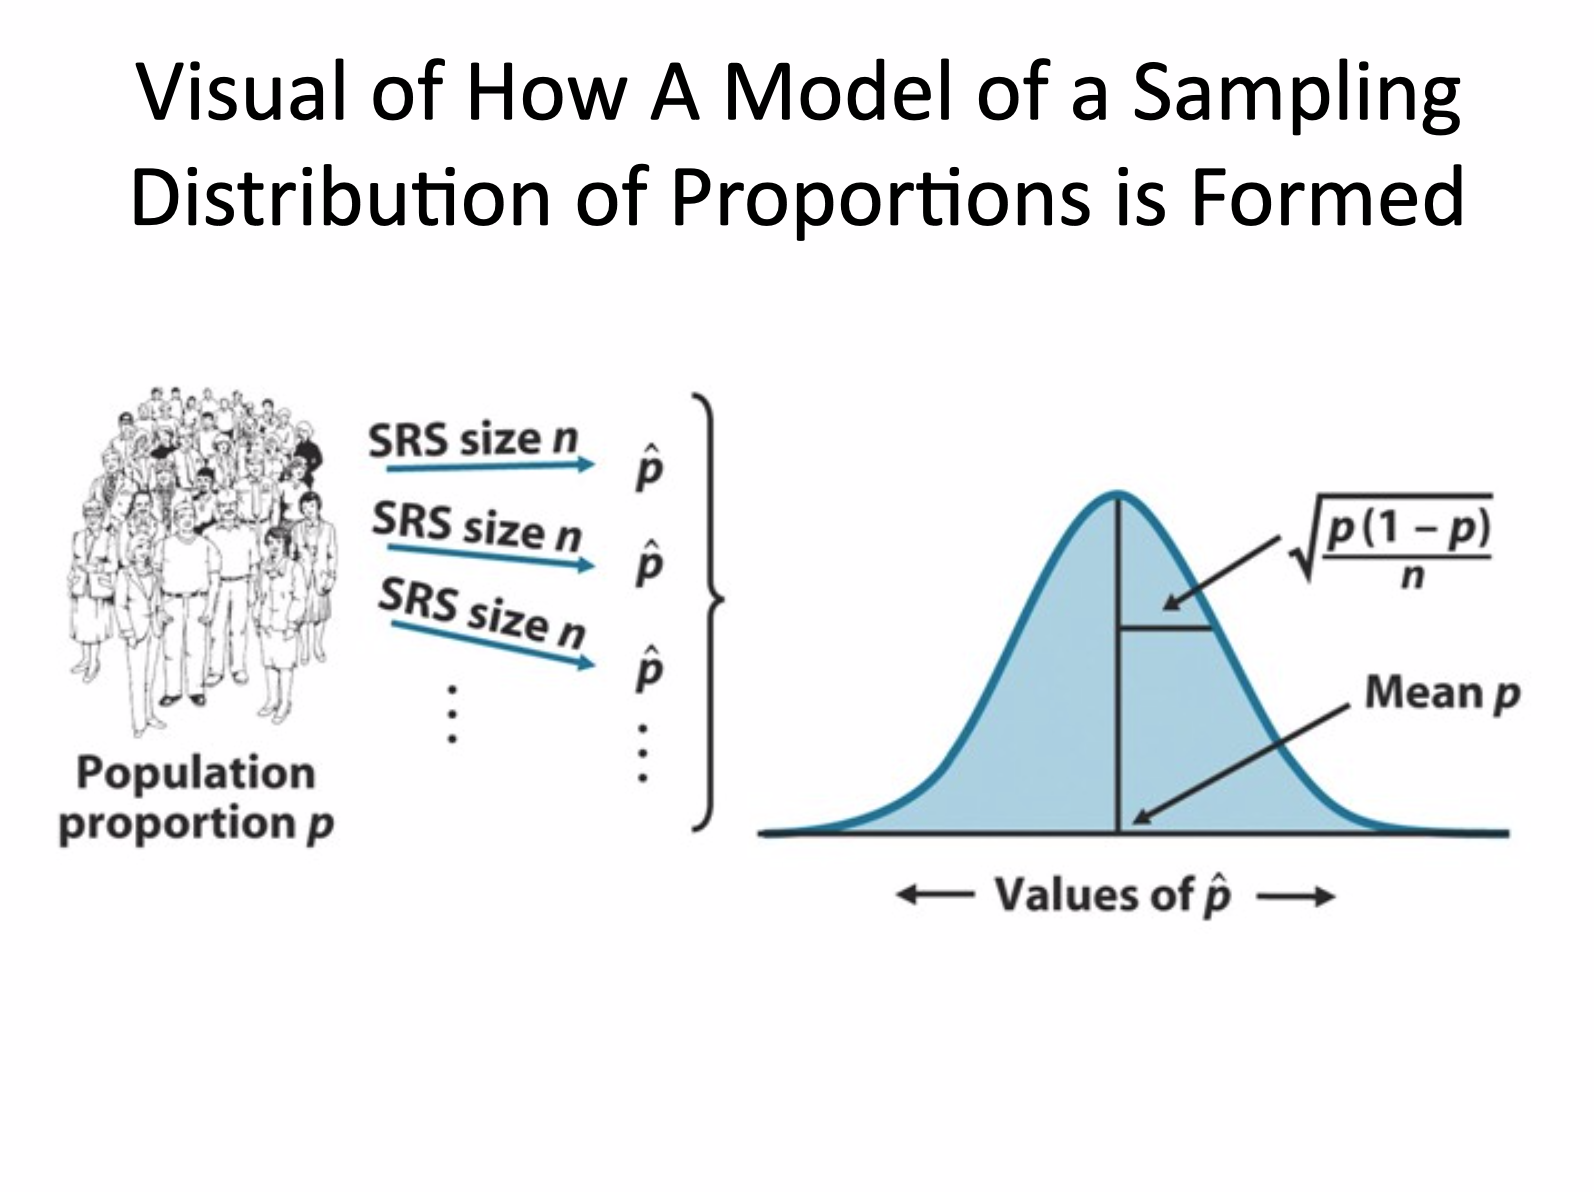
- The sampling distribution of a proportion
Sampling Distributions for Proportions
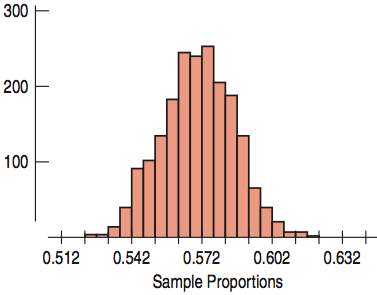
Sampling Distribution for Proportions
- Symmetric
- Unimodal
- Centered at p
- The sampling distribution follows the Normal model.
What does the sampling distribution tell us?
- The sampling distribution allows us to make statements about where we think the corresponding population parameter is and how precise these statements are likely to be.
From One Sample to Many Samples
Distribution of One Sample
- Variable was the answer to the survey question or the result of an experiment.
- Proportion is a fixed value that comes from the one sample.
Sampling Distribution
- Variable is the proportion that comes from the entire sample.
- Many proportions that differ from one to another, each coming from a different sample.
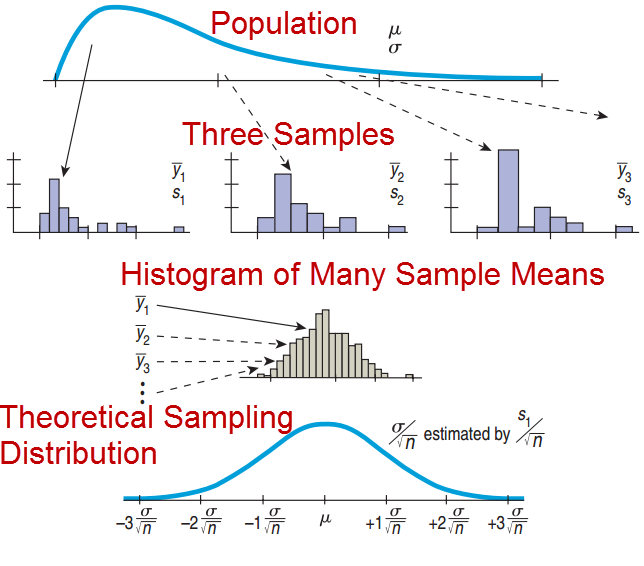
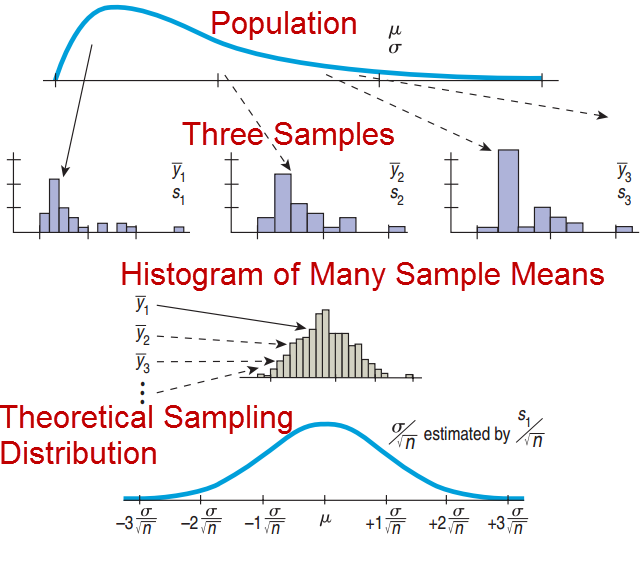
*Sampling Distributions for Means (CLT)*
![]()
Mean and Standard Deviation
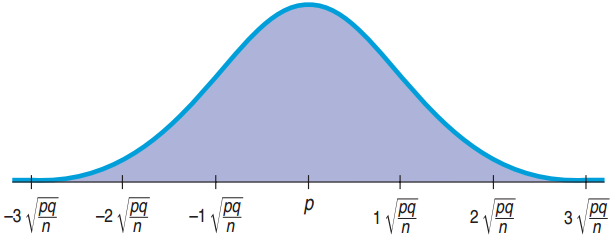
Sampling Distribution for Proportions
- \(\text{Mean} = p\)
- \(\sigma(\hat{p}) = \dfrac{\sqrt{npq}}{n} = \sqrt{\dfrac{pq}{n}}\)
- \(N\left(p, \sqrt{\dfrac{pq}{n}}\right)\)
This p is a parameter!
Instead \(\hat{p}\) is a statistic!
The Normal Model for Climate Change
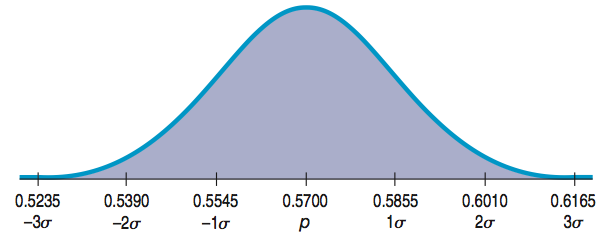
Population: p = 0.57, n = 1022. Sampling Distribution:
- Mean = 0.57
- Standard deviation \(= SD(\hat{p}) = \sqrt{\dfrac{(0.57)(0.43)}{1022}} \approx 0.0155\)
![]()
Standard Deviation for a Proportion?
What is the sampling distribution?
- Usually we do not know the population proportion p.
- We cannot find the standard deviation of the sampling distribution:
\[\sqrt{\frac{pq}{n}}\]
- After taking a sample, we only know the sample proportion, which we use as an approximation.
- The sample-to-sample standard deviation is called the standard error or sampling variability
- The standard error is given by
\[SE\left(\hat{p}\right) = \sqrt{\frac{\hat{p}\hat{q}}{n}}\]
Facebook Daily Status Updates
A recent survey found that 48 of 156 respondents or 30.8% update Facebook status daily.
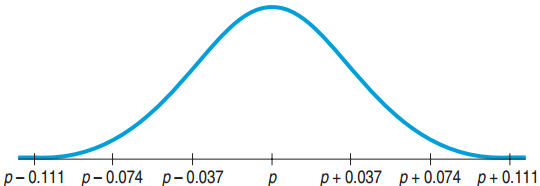
\[SE\left(\hat{p}\right) = \sqrt{\frac{\hat{p}\hat{q}}{n}} = \sqrt{\frac{(0.308)(0.692)}{156}} \approx 0.037\]
- The sampling distribution is approximately normal.
Facebook: true population proportion?
A recent survey found that 48 of 156 or 30.8% update their Facebook status daily.
- This is the sample proportion
- What is the true population proportion?
- To find it, we need to make an inference using the sampling distribution we just found, based on SE
Interpreting this Normal Curve
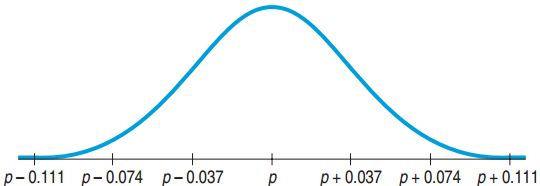
- By normality, about 95% of all possible samples of 156 young Facebook users will have \(\hat{p}\)’s within 2 SE (0.037) of p
- If \(\hat{p}\) is close to p, then p is close to \(\hat{p}\).
- If you stand at \(\hat{p}\), then you can be 95% sure that p is within 2 SE’s from where you are standing.
- → Our confidence interval: (0.234, 0.382)
What You Can Say About p if You Know \(\hat{p}\)
We don’t know exactly what percent of all Facebook users update their status daily, but the interval from 23.4% to 38.2% probably contains the true proportion.
- Note, we admit we are unsure about both the exact proportion and whether it is in the interval.
We are 95% confident that between 23.4% and 38.2% of all Facebook users update their status daily.
- Notice “% confident” and an interval rather than an exact value are stated.
What You Cannot Say About p if You Know \(\hat{p}\)
30.8% of all Facebook users update their status daily.
- We can’t make such absolute statements about p.
It is probably true that 30.8% of all Facebook users update their status daily.
- We still cannot commit to a specific value for p, only a range.
We don’t know exactly what percent of all Facebook users update their status daily, but we know it is within the interval 30.8% ± 2 x 3.7%.
- We cannot be certain it is in this interval.
Naming the Confidence Interval
This confidence interval is a one-proportion z-interval.
- “One” since there is a single survey question.
- “Proportion” since we are interested in the proportion of Facebook users who update their status daily.
- “z-interval” since the distribution is approximately normal.
Simulating Confidence Intervals
![]()
Margin of Error
- Confidence interval for a population proportion (95%):
\[\hat{p} \pm 2SE\left(\hat{p}\right)\]
- The distance, \(2SE\left(\hat{p}\right)\), from \(\hat{p}\) is called the margin of error.
- Confidence intervals also work for means, regression slopes, and others. In general, the confidence interval has the form
\[\text{Estimate} \pm ME\]
Certainty vs. Precision
- Instead of a 95% confidence interval, any percent can be used.
- Increasing the confidence (e.g. 99%) increases the margin of error.
- Decreasing the confidence (e.g. 90%) decreases the margin of error.
Critical Values
- For a 95% confidence interval, the margin of error was 2SE.
- The 2 comes from the normal curve.
- 95% of the area is within about 2SE from the mean.
- In general the number of SE is called the critical value. Since we use the normal distribution here we denote it \(z^*\)
- To be more precise, \(z^*\) for 95% CI is 1.96
Independence and Sample Size
- Independence Condition
- If data is collected using SRS or a randomized experiment → Randomization Condition
- Some data values do not influence others.
- Check for the 10% Condition: The sample size is less than 10% of the population size.
- Success/Failure Condition
- There must be at least 10 successes.
- There must be at least 10 failures.
One-Proportion z-Interval
- First check for randomization, independence, 10%, and conditions on sample size.
- Confidence level C, sample size n, proportion \(\hat{p}\).
- Confidence interval: \(\hat{p} \pm z^{*}SE\left(\hat{p}\right)\)
- \(SE\left(\hat{p}\right) = \sqrt{\dfrac{(\hat{p})(\hat{q})}{n}}\)
- \(z^*\): the critical value that specifies the number of SE’s needed for C% of random samples to yield confidence intervals that capture the population proportion.
Do You Believe the Death Penalty is Applied Fairly?
- Mechanics: n = 510, \(\hat{p} = 0.58\)
Do You Believe the Death Penalty is Applied Fairly?
- Mechanics: n = 510, \(\hat{p} = 0.58\)
\[SE(\hat{p}) = \sqrt{\frac{(0.58)(0.42)}{510}} \approx 0.022\]
- \(z^* \approx 1.96\)
- \(ME \approx (1.96)(0.022) \approx 0.043\)
- The 95% Confidence Interval is: 0.58 ± 0.043 or (0.537, 0.623)
Do You Believe the Death Penalty is Applied Fairly?
- Conclusion: I am 95% confident that between 53.7% and 62.3% of all US adults think that the death penalty is applied fairly.
What Sample Size?
\[ME = z^* \sqrt{\frac{\hat{p}\hat{q}}{n}}\]
- For example, to ensure a ME < 3%:
- For 95%, \(z^* = 1.96\)
What Sample Size?
\[ME = z^* \sqrt{\frac{\hat{p}\hat{q}}{n}}\]
- For example, to ensure a ME < 3%:
- For 95%, \(z^* = 1.96\)
- Values that make ME largest are \(\hat{p} = 0.5,\ \hat{q} = 0.5\)
\[0.03 = 1.96\sqrt{\frac{(0.5)(0.5)}{n}}\]
- Solving for n, gives n ≈ 1067.1.
- We need to survey at least 1068 to ensure a ME less than 0.03 for the 95% confidence interval.
The Yale/George Mason Survey and Sample Size
Poll: 40% believe scientists disagree on global warming.
- For a follow-up survey, what sample size is needed to obtain a 95% confidence interval with ME ≤ 2%?
\[ME = z^* \sqrt{\frac{\hat{p}\hat{q}}{n}}\]
The Yale/George Mason Survey and Sample Size
Poll: 40% believe scientists disagree on global warming.
- For a follow-up survey, what sample size is needed to obtain a 95% confidence interval with ME ≤ 2%?
\[ME = z^* \sqrt{\frac{\hat{p}\hat{q}}{n}} \qquad 0.02 = 1.96\sqrt{\frac{(0.4)(0.6)}{n}}\]
- n ≈ 2304.96
- The group will need at least 2305 respondents.
Thoughts on Sample Size and ME
- Obtaining a large sample size can be expensive and/or take a long time.
- For a pilot study, ME = 10% can be acceptable.
- For full studies, ME ≤ 5% is better.
- Public opinion polls typically use ME = 3%, n = 1000.
- If p is expected to be very small such as 0.005, then much smaller ME such as 0.1% is required.
Chapter 19
Testing Hypotheses About Proportions
Cracking Rate < 20%?
General cracking rate: 20%
After a new engineering process, the cracking rate of 400 casts fell to 17%!
Is this due to the new engineering or just random chance?
- Null Hypothesis (\(H_0\)): Nothing has changed
- \(H_0\): hypothesized value = parameter
- \(H_0\): p = 0.20
- Alternative Hypothesis:
Step 1: State the Hypotheses
\(H_0\):
- \(H_0\) usually states that there’s nothing different.
- \(H_0\): hypothesized value = parameter value
- Note the parameter describes the population not the sample.
- \(H_0\) is called the null hypothesis.
\(H_A\):
- \(H_A\) is a statement that something has changed, gotten bigger or smaller
- \(H_A\) is called the alternative hypothesis.
1-Proportion z-Test
Conditions
- Same as a 1-Proportion z-Interval
Null Hypothesis
Test Statistics
\[z = \frac{\hat{p} - p_0}{SD\left(\hat{p}\right)} \qquad SD\left(\hat{p}\right) = \sqrt{\frac{p_0 q_0}{n}}\]
Checking Conditions and Finding the Standard Error
Checking Conditions: n = 400, p = 0.20
- np = (400)(0.20) = 80 ≥ 10
- nq = (400)(0.80) = 320 ≥ 10
- Independence plausible
- The Normal model applies.
Find the standard deviation of the model.
\[SD(\hat{p}) = \sqrt{\frac{pq}{n}} = \sqrt{\frac{(0.20)(0.80)}{400}} = 0.02\]
- Note: Use p and not \(\hat{p}\) to find standard deviation.
Using the Normal Model
\[z = \frac{\hat{p} - p_0}{SD\left(\hat{p}\right)}\]
p = 0.20, \(\hat{p}\) = 0.17, \(SD(\hat{p})\) = 0.02
Using the Normal Model
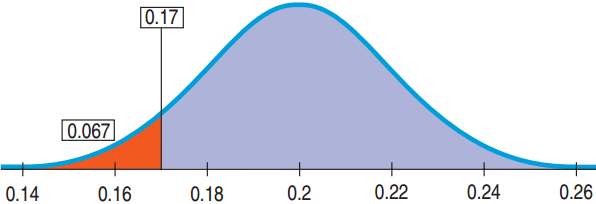
p = 0.20, \(\hat{p}\) = 0.17, \(SD(\hat{p})\) = 0.02
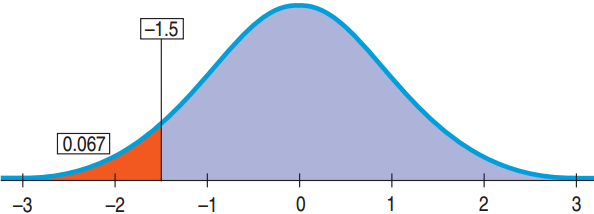
\[z = \frac{0.17 - 0.20}{0.02} = -1.5\]
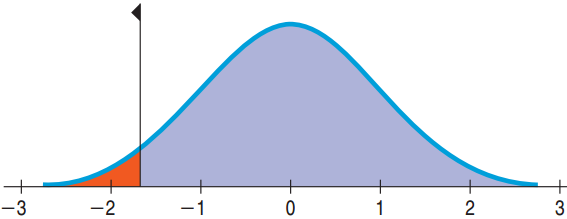
\[P(z < -1.5) \approx 0.067\]
- If the null hypothesis is true that the cracking rate is still equal to 20%, then the probability of observing a cracking rate of 17% in a random sample of 400 is 6.7%.
The P-Value and Surprise
The P-value is the probability of seeing data like these (or even more unlikely-extreme data) given the null hypothesis is true.
- Tells us how surprised we would be to get these data given \(H_0\) is true.
- P-value small: Either \(H_0\) is not true or something remarkable occurred
- P-value not small enough: Not a surprise. Data consistent with the model. Do not reject \(H_0\).
Guilty or Not Enough Evidence?
Defendant is either
- Guilty: P-value too small. The evidence is clear.
- Not Guilty: P-value not small enough. The evidence is not sufficient. Not the same as innocent. Maybe innocent or maybe guilty, but not enough evidence found.
Two Choices
- Fail to reject \(H_0\) if P-value large. Never accept \(H_0\).
- Reject \(H_0\) if P-value is small. Accept \(H_A\).
19.4
Alternative Alternatives
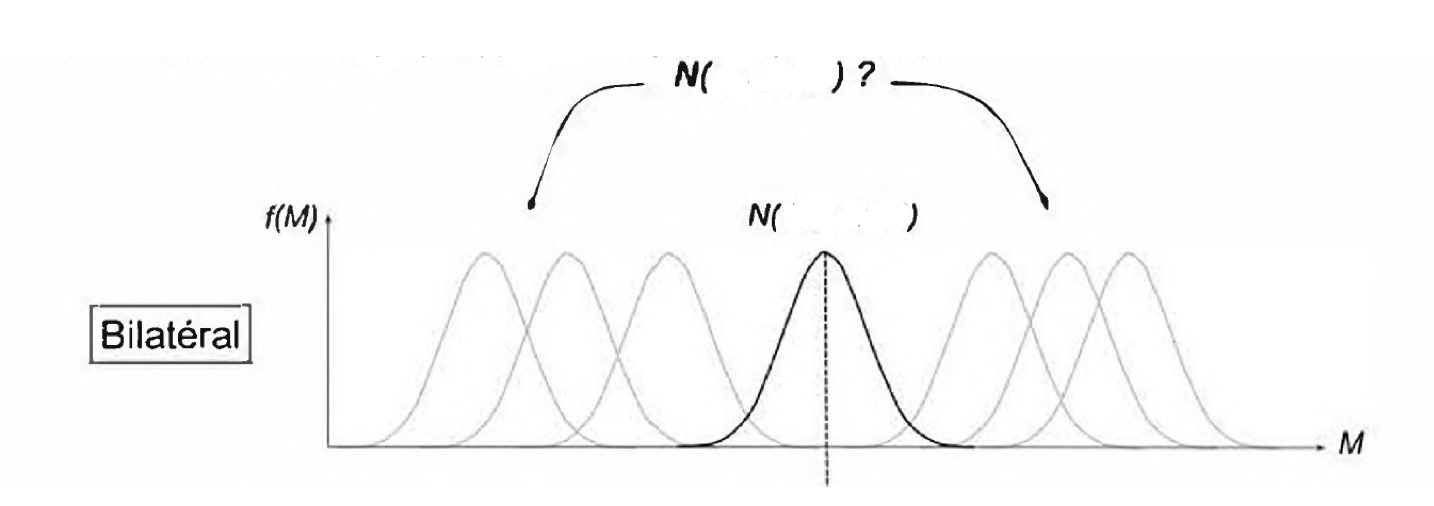
Two-Sided Alternative
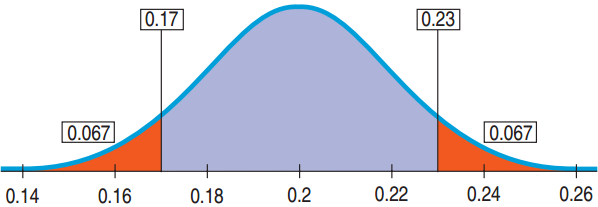
For the new process the engineer may be interested in whether there has been a change in the cracking rate not just a decrease.
- \(H_0\): p = 0.20
- \(H_A\): p ≠ 0.20
- An alternative hypothesis where we are interested in deviation on either side is called a two-sided alternative.
- The P-value is the probability of deviating from either direction from the null hypothesis.
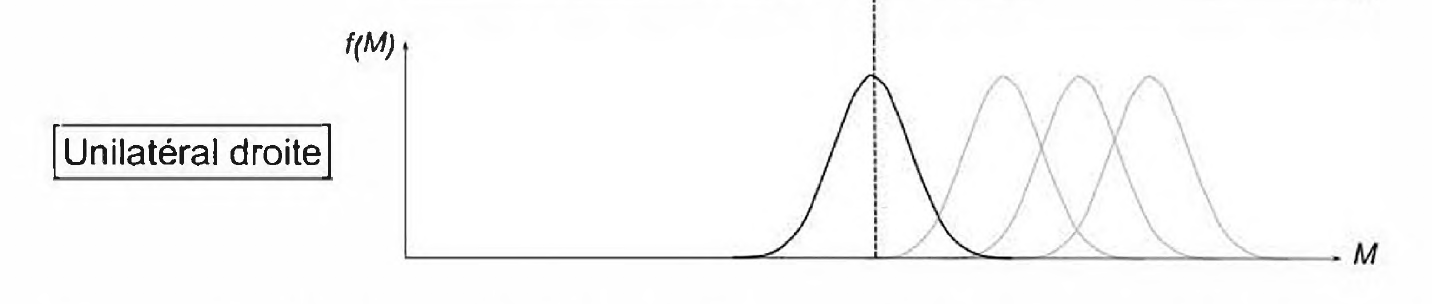
One-Sided Alternative
The engineer may be interested in whether there has been a decrease in the cracking rate.
- \(H_0\): p = 0.20
- \(H_A\): p < 0.20
- An alternative hypothesis where we are interested in deviation on only one side is called a one-sided alternative.
- The P-value for a one-sided alternative is always half the P-value for the two-sided alternative.
Not the Right Proportion of Male Babies?
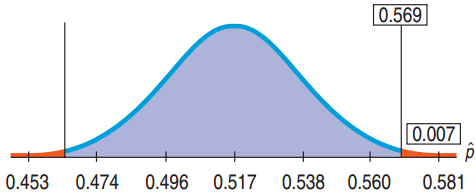
Under natural conditions, 51.7% of births are male. In Punjab India’s hospital 56.9% of the 550 births were male.
- Question: Is there evidence that the proportion of male births is different for this hospital?
- What is the probability of getting a result as different as 56.9% or more different?
- Plan: We will have a two-tailed alternative. The parameter of interest is p.
- \(H_0\): p = 0.517
- \(H_A\): p ≠ 0.517
Not the Right Proportion of Male Babies?
- Model: Check the conditions
- Independence Assumption: The sex of one baby should not affect the sex of others.
- Randomization Conditions: The births were not random, so be cautious of the results.
- 10% Condition: 550 births is certainly less than the total number of all births.
Not the Right Proportion of Male Babies?
- Model: Check the conditions (Continued).
- Success/Fail Condition: (550)(0.517) ≥ 10, (550)(0.483) ≥ 10
- The Normal model does apply.
- We can use a one-proportion z-test.
Not the Right Proportion of Male Babies?
\[SD(\hat{p}) = \sqrt{\frac{p_0 q_0}{n}} \approx \sqrt{\frac{(0.517)(1 - 0.517)}{550}} \approx 0.0213\]
\[z = \frac{\hat{p} - p_0}{SD\left(\hat{p}\right)} = \frac{0.569 - 0.517}{0.0213} \approx 2.44\]
Not the Right Proportion of Male Babies?
Show →
![]()
\[\text{P-value} = 2P(z > 2.44) = 2(0.0073) = 0.0146\]
Not the Right Proportion of Male Babies?
- Conclusion:
- Interpreting the P-value = 0.0146
- If the proportion of male babies were still 51.7%, then an observed proportion as different as 56.9% male babies would occur at random about 15 times in 1000.
- This is so small a chance that I reject \(H_0\). There is strong evidence that the proportion of boys is not equal to the baseline for the region. It appears larger.
19.5
P-Values and Decisions: What to Tell About a Hypothesis Test
How Small a P-Value is Small Enough?
How small is small enough is context specific.
- Test to see if a renowned musicologist can distinguish between Mozart and Haydn.
- P-value of 0.1 may be good enough. Just reaffirming known talent.
- A friend claims psychic abilities and can predict heads or tails.
- Very small P-value such as 0.01 needed. Breaking scientific theory.
Acceptable P-Value Depends on Result’s Importance
Proportion of students in school with full time jobs has increased.
- Social issue. P-value = 0.05 will work.
Testing the proportion of faulty rivets that hold together the wings of a commercial aircraft is now below the danger threshold.
- Life and death decision. Need a very small P-value
- Whether rejecting or failing to reject, always cite the P-value.
- An accompanying confidence interval helps also.
Home Field Advantage?
Is there a home field advantage in baseball?
- The home team won 1308 of the 2431 (53.81%) games played in the season.
- Is there evidence to suggest that the home team wins more than 50%?
- Plan: p = proportion of home team wins
- Hypotheses
- \(H_0\): p = 0.50
- \(H_A\): p > 0.50
Home Field Advantage?
Model →
- Independence Assumption: Questionable, but the 2013 season may be representative of all games past and future.
- 10% Condition: The 2013 season is less than 10% of all games played past and future.
- Success/Failure Condition:
- np = (2431)(0.5) ≥ 10
- nq = (2431)(0.5) ≥ 10
- The Normal Model Applies: Conduct a one-proportion z-test.
Home Field Advantage?
\[SD(\hat{p}) = \sqrt{\frac{p_0 q_0}{n}} \approx \sqrt{\frac{(0.5)(1 - 0.5)}{2431}} \approx 0.010141\]
\[z = \frac{\hat{p} - p_0}{SD\left(\hat{p}\right)} = \frac{0.53805 - 0.5}{0.010141} \approx 3.75\]
- The P-value is about 0.0001.
Home Field Advantage?
- Conclusion: The P-value of 0.0001 says that if the true proportion of home teams wins is 0.5 then an observed value of 0.53805 would occur less than 1 time in 1000.
- This is so unlikely, so reject \(H_0\).
- There is reasonable evidence that the true proportion of home team wins is greater than 50%.
- There appears to be a home field advantage.
How Big a Home Field Advantage?
- Model:
- Success Failure Condition (notice difference!)
- Home team wins: 1308 ≥ 10
- Home team losses: 1123 ≥ 10
- Sampling distribution follows the Normal model.
- Find the one-proportion z-interval.
How Big a Home Field Advantage?
- Mechanics (notice difference!):
\[SE(\hat{p}) = \sqrt{\frac{\hat{p}\hat{q}}{n}} \approx \sqrt{\frac{(0.53805)(1 - 0.53805)}{2431}} \approx 0.01011\]
- For 95% confidence, \(z^*\) = 1.96.
\[ME = z^* \times SE(\hat{p}) = 1.96 \times 0.01011 = 0.0198\]
- A 95% confidence interval is: 0.53805 ± 0.0198 or (0.5182, 0.5579).
How Big a Home Field Advantage?
Tell →
- Conclusion: I am 95% confident that, in professional baseball, home teams win between 51.82% and 55.79% of the games.
- For a 162-game season, the low end gives the home team about 1/2 of an extra victory and the high end, about 4 extra wins.
What Can Go Wrong?
Don’t base your \(H_0\) on what you see in the data.
- Changing the null hypothesis after looking at the data is just wrong.
Don’t base your \(H_A\) on the data.
- Both the null and alternative hypotheses must be stated before peeking at the data.
Don’t make \(H_0\) what you want to show to be true.
- \(H_0\) represents the status quo. You can never accept the null hypothesis.
What Can Go Wrong?
Don’t forget to check the conditions.
- Randomization, independence, and sample size
Don’t accept the null hypothesis.
- You can only say you don’t have evidence to reject \(H_0\) (you can only say you “fail to reject”).
If you fail to reject \(H_0\) don’t expect a larger sample would reject \(H_0\).
- Check the confidence interval. If its values would not matter to you, then a larger sample will unlikely be worthwhile.
Chapter 20
Inferences About Means
20.1
Getting Started: The Central Limit Theorem (Again)
The Central Limit Theorem (CLT)
When random samples are drawn from a population with mean \(\mu\) and standard deviation \(\sigma\), the sampling distribution has:
- Mean: \(\mu\)
- Standard deviation: \(\dfrac{\sigma}{\sqrt{n}}\)
- Approximately Normal distribution as long as the sample size is large.
- The larger the distribution, the closer to Normal.
Sampling Distributions for Means (CLT)
![]()
Weight of Angus Cows
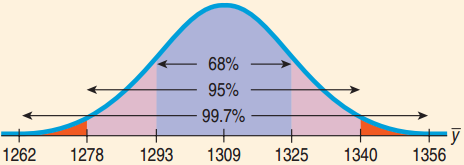
The weight of Angus cows is Normally distributed with \(\mu\) = 1309 pounds and \(\sigma\) = 157 lbs. What does the CLT say about the mean weight of a random sample of 100 Angus cows?
- Sample means \(\bar{y}\) will average 1309 pounds.
\[SD(\bar{y}) = \frac{\sigma}{\sqrt{n}} = \frac{157}{\sqrt{100}} = 15.7 \text{ pounds}\]
Weight of Angus Cows (Continued)
- The CLT says the sampling distribution will be approximately Normal: N(1309, 15.7).
![]()
For the means of all random samples,
- 68% will be between 1293.3 and 1324.7 lb.
- 95% will be between 1277.6 and 1340.4 lb.
- 99.7% will be between 1261.9 and 1356.1 lb.
The Challenge of the CLT
- CLT tells us \(SD(\bar{y}) = \dfrac{\sigma}{\sqrt{n}}\)
- We would like to use this for Confidence Intervals and Hypothesis Testing.
- Unfortunately, we almost never know \(\sigma\).
- Using s almost works: \(SE(\bar{y}) = \dfrac{s}{\sqrt{n}}\), but not quite.
- When using s, the Normal model has some error.
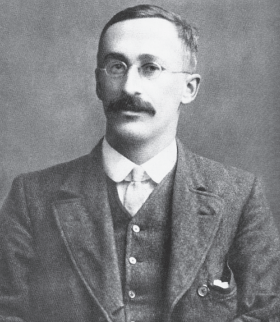
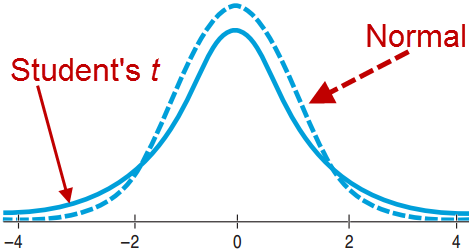
- William Gosset came up with new models, one for each n that works better.
Gosset at Guinness!
At Guinness, Gosset experimented with beer.
- The Normal Model was not right, especially for small samples.
- Still bell shaped, but details differed, depending on n
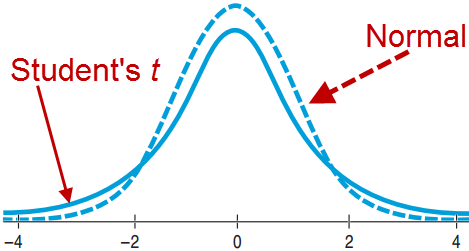
- Came up with the “Student’s t Distribution” as the correct model
Degrees of Freedom
- For every sample size n there is a different Student’s t distribution.
- Degrees of freedom: df = n – 1.
- Similar to the “n – 1” in the formula for sample standard deviation
- It is the number of independent quantities left after we’ve estimated the parameters.
Confidence Interval for Means
Sampling Distribution Model for Means
- With certain conditions (seen later), the standardized sample mean follows the Student’s t model with n – 1 degrees of freedom.
\[t = \frac{\bar{y} - \mu}{SE(\bar{y})}\]
- We estimate the standard deviation with
\[SE(\bar{y}) = \frac{s}{\sqrt{n}}\]
One Sample t-Interval for the Mean
- When the assumptions are met (seen later), the confidence interval for the mean is
\[\bar{y}\ \pm\ t^{*}_{n-1} \times SE(\bar{y})\]
- The critical value \(t^{*}_{n-1}\) depends on the confidence level, C, and the degrees of freedom n – 1.
Contaminated Salmon
\[SE(\bar{y}) = \frac{s}{\sqrt{n}}\]
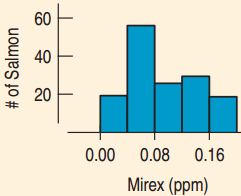
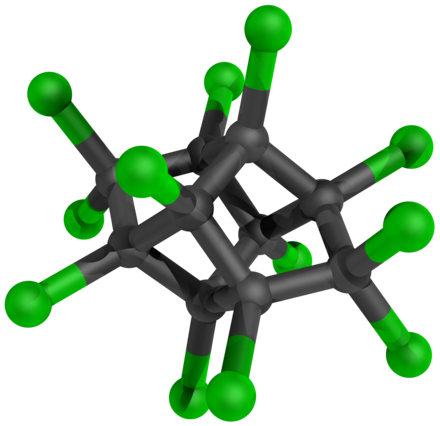
A study of mirex concentrations in salmon found
- n = 150, \(\bar{y}\) = 0.0913 ppm, s = 0.0495 ppm
- Find a 95% confidence interval for mirex concentrations in salmon.
- Find df, SE and get t*
Contaminated Salmon
A study of mirex concentrations in salmon found
- n = 150, \(\bar{y}\) = 0.0913 ppm, s = 0.0495 ppm
- Find a 95% confidence interval for mirex concentrations in salmon.
- df = 150 – 1 = 149
\[SE(\bar{y}) = \frac{0.0495}{\sqrt{150}} \approx 0.0040\]
- \(t^{*}_{149} = 1.976\)
- (from technology, or 1.977 using table with df=140)
Contaminated Salmon
\[\bar{y}\ \pm\ t^{*}_{n-1} \times SE(\bar{y})\]
Confidence Interval for \(\mu\)
Contaminated Salmon
Confidence Interval for \(\mu\)
\[\bar{y} \pm t^{*}_{149} \times SE(\bar{y}) = 0.0913 \pm 1.976(0.0040)\] \[= 0.0913 \pm 0.0079\] \[= (0.0834,\ 0.0992)\]
- I’m 95% confident that the mean level of mirex concentration in farm-raised salmon is between 0.0834 and 0.0992 parts per million.
Thoughts about z and t
- The Student’s t distribution:
- Is unimodal.
- Is symmetric about its mean.
- Has higher tails than Normal.
- Is very close to Normal for large df.
- Is needed because we are using s as an estimate for \(\sigma\).
- If you happen to know \(\sigma\), which almost never happens, use the Normal model and not Student’s t.
Assumptions and Conditions
Independence Condition
- Randomization Condition: The data should arise from a suitably randomized experiment.
- Sample size < 10% of the population size.
Original Distribution Nearly Normal
- For large sample sizes (n > 40), not severely skewed.
- (15 ≤ n ≤ 40): Need unimodal and symmetric.
- (n < 15): Need almost perfectly normal.
- Check with a histogram.
Assumptions for Salmon Contamination Study
Researchers tested 150 salmon from 51 farms in eight regions in six countries. Are the assumptions and conditions for inference satisfied?
- Independence Assumption: Not a random sample, but likely independently selected.
- Nearly Normal Condition: The histogram is unimodal and not highly skewed. OK since sample size is 51.
How Much Sleep do College Students Get?
Build a 90% Confidence Interval for the Mean.
- Plan: Data on 25 Students
Model →
- Randomization Condition: The data are from a random survey.
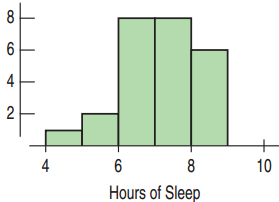
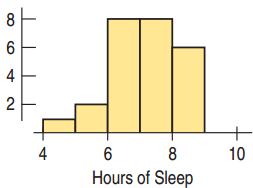
- Nearly Normal Condition: Unimodal and slightly skewed, so OK
- Use Student’s t-Model with df = 25 – 1 = 24.
- One-sample t-interval for the mean
How Much Sleep?
- Mechanics: n = 25, \(\bar{y}\) = 6.64, s = 1.075
How Much Sleep?
- Mechanics: n = 25, \(\bar{y}\) = 6.64, s = 1.075
\[SE(\bar{y}) = \frac{s}{\sqrt{n}} = \frac{1.075}{\sqrt{25}} = 0.215 \text{ hours}\]
- \(t^{*}_{24} = 1.711\) (from table, 24 df, CI → 2 tails)
\[ME = t^{*}_{24} \times SE(\bar{y}) = 1.711 \times 0.215 = 0.368 \text{ hours}\]
\[90\%\ \text{CI} = 6.64 \pm 0.368 = (6.272,\ 7.008)\]
How Much Sleep do College Students Get?
- Conclusion: I’m 90 percent confident that the interval from 6.272 and 7.008 hours contains the true population mean number of hours that college students sleep.
- Be careful about convenience sampling!
Make a Picture
Always Test the Normality Assumption
- Create a histogram to check for near normality.
- Good for seeing the nature of the deviations: outliers, not symmetric, skewed
- Also create a normal probability plot to see that it is reasonably straight.
- Good for checking for normality
- With technology at hand, there is no excuse not to make these two plots.
20.3
Interpreting Confidence Intervals
What Not to Say
Don’t Say
- “90% of all students sleep between 6.272 and 7.008 hours each night.”
- The CI is for the mean sleep, not individual students.
- “We are 90% confident that a randomly selected student will sleep between 6.272 and 7.008 hours per night.”
- We are 90% confident about the mean sleep, not an individual’s sleep.
What Not to Say (Continued)
Don’t Say
- “The mean amount of sleep is 6.64 hours 90% of the time.”
- The population mean never changes. Only sample means vary from sample to sample.
- “90% of all samples will have a mean sleep between 6.272 and 7.008 hours per night.”
- This interval does not set the standard for all other intervals. This interval is no more likely to be correct than any other.
What You Should Say
Do Say
- “90% of all possible samples will produce intervals that actually do contain the true mean sleep.”
- This is the essence of the CI, but it may be too formal for general readers.
- “I am 90% confident that the true mean amount that students sleep is between 6.272 and 7.008 hours per night.”
- This is more personal and less technical.
20.4
A Hypothesis Test for the Mean
One-Sample t-Test for the Mean
- Assumptions are the same.
- \(H_0\): \(\mu = \mu_0\)
\[t_{n-1} = \frac{\bar{y} - \mu_0}{SE(\bar{y})}\]
- Standard Error \(SE(\bar{y}) = \dfrac{s}{\sqrt{n}}\)
- When the conditions are met and \(H_0\) is true, the statistic follows the Student’s t Model.
- Use this model to find the P-value.
Are the Salmon Unsafe?
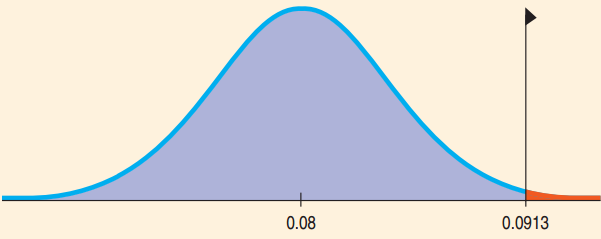
EPA recommended mirex screening is 0.08 ppm.
- Are farmed salmon contaminated beyond the permitted EPA level?
- Recap: Sampled 150 salmon. Mean 0.0913 ppm, Standard Deviation 0.0495 ppm.
- \(H_0\): \(\mu\) = 0.08
- \(H_A\): \(\mu\) > 0.08
Are the Salmon Unsafe?
One-Sample t-Test for the Mean
- n = 150, df = 149, \(\bar{y}\) = 0.0913, s = 0.0495 – in this case we can calculate t!
\[SE(\bar{y}) = \frac{s}{\sqrt{n}} \qquad t = \frac{\bar{y} - \mu}{SE(\bar{y})}\]
Are the Salmon Unsafe?
One-Sample t-Test for the Mean
- n = 150, df = 149, \(\bar{y}\) = 0.0913, s = 0.0495
\[SE(\bar{y}) = \frac{0.0495}{\sqrt{150}} \approx 0.0040, \quad t_{149} = \frac{0.0913 - 0.08}{0.0040} = 2.825\]
- \(P(t_{149} > 2.825) = 0.0027\) or P < 0.005 using the t-table
- Since the P-value is so low, reject \(H_0\) and conclude that the population mean mirex level does exceed the EPA screening value.
Do Students Get at Least Seven Hours of Sleep? 25 Surveyed.
- Plan: Is the mean amount of sleep less than 7 hours?
- Hypotheses: \(H_0\): \(\mu\) = 7 \(H_A\): \(\mu\) < 7
- Model
- Randomization Condition: The students were randomly and independently selected.
- Nearly Normal Condition: Unimodal and symmetric
- Use the Student’s t-model, df = 24
- One-sample t-test for the mean
Do Students Get at Least Seven Hours of Sleep? 25 Surveyed.
- Mechanics: n = 25, \(\bar{y}\) = 6.64, s = 1.075
Do Students Get at Least Seven Hours of Sleep? 25 Surveyed.
- Mechanics: n = 25, \(\bar{y}\) = 6.64, s = 1.075
\[SE(\bar{y}) = \frac{s}{\sqrt{n}} = \frac{1.075}{\sqrt{25}} = 0.215 \text{ hours}\]
\[t = \frac{\bar{y} - \mu_0}{SE(\bar{y})} = \frac{6.64 - 7.0}{0.215} \approx -1.67\]
\[\text{P-value} = P(t_{24} < -1.67) \approx 0.054\]
Or between 0.05 and 0.10 using the t-table
Do Students Get at Least Seven Hours of Sleep? 25 Surveyed.
- Conclusion: P-value = 0.054 says that if students do sleep an average of 7 hrs., samples of 25 students can be expected to have an observed mean of 6.64 hrs. or less about 54 times in 1000.
- With 0.05 cutoff, there is not quite enough evidence to conclude that the mean sleep is less than 7.
- The 90% CI: (6.272, 7.008) contains 7.
- Collecting a larger sample would reduce the ME and give us a better handle on the true mean hours of sleep.
Relationship between Intervals and Tests
Confidence Intervals
- Start with data and find plausible values for the parameter.
- Always 2-sided
Hypothesis Tests
- Start with a proposed parameter value and then use the data to see if that value is or is not still plausible.
- 2-sided test: Within the confidence interval means fail to reject \(H_0\). P-value = 1 – C is the cutoff.
- 1-sided test: P-value = (1 – C)/2 is the cutoff.
Sleep, Confidence Intervals and Hypothesis Tests
90% Confidence interval mean hours slept: (6.272, 7.008)
- For a 2-tailed test with a 10% cutoff, any 6.272 ≤ \(\mu_0\) ≤ 7.008 would result in failing to reject \(H_0\).
- For a 1-tailed test (“<”) with a 5% cutoff, any \(\mu_0\) ≤ 7.008 would result in failing to reject \(H_0\).
- For a 1-tailed test (“>”) with a 5% cutoff, any 6.272 ≤ \(\mu_0\) would result in failing to reject \(H_0\).
The Special Case with Proportions
Confidence Intervals
- Use \(\hat{p}\) to calculate \(SE\left(\hat{p}\right)\).
Hypothesis Tests
- Use p to calculate SD(p).
If \(SE\left(\hat{p}\right)\) and SD(p) are far from each other, the relationship between the confidence interval and the hypothesis test breaks down.
20.5
Choosing the Sample Size
The Challenge of Finding the Sample Size
\[ME = t^{*}_{n-1} \times \frac{s}{\sqrt{n}}\]
- To find the necessary sample size in order to have a small enough margin of error:
- Decide on acceptable ME.
- Determine s: Use a pilot to estimate s.
- Determine \(t^{*}_{n-1}\): Use \(z^*\) as an estimate. By the 68-95-99.7 Rule, use 2 for 95% confidence.
Finding the Sample Size
\[ME = t^{*}_{n-1} \times \frac{s}{\sqrt{n}}\]
Should we buy a movie download accelerator? With a free trial we can test several download times in order to obtain a 95% CI to estimate the mean download time with a ME < 8 minutes. Assume \(\sigma\) = 10 minutes.
Finding the Sample Size
Should we buy a movie download accelerator? With a free trial we can test several download times in order to obtain a 95% CI to estimate the mean download time with a ME < 8 minutes. Assume \(\sigma\) = 10 minutes.
\[8 = 2 \times \frac{10}{\sqrt{n}}, \quad \sqrt{n} = \frac{20}{8}, \quad n = 6.25\]
Finding the Sample Size
Should we buy a movie download accelerator? With a free trial we can test several download times in order to obtain a 95% CI to estimate the mean download time with a ME < 8 minutes. Assume \(\sigma\) = 10 minutes.
\[8 = 2 \times \frac{10}{\sqrt{n}}, \quad \sqrt{n} = \frac{20}{8}, \quad n = 6.25\]
- With the small sample size, \(z^*\) and \(t^*\) differ.
\[t^{*}_{5} = 2.571\]
Finding the Sample Size
\[8 = 2.571 \times \frac{10}{\sqrt{n}}\]
\[\sqrt{n} = \frac{2.571 \times 10}{8} \approx 3.214, \quad n \approx 10.33\]
- To make sure ME is no larger than 8 minutes, round up.
- We’ll find the downloading times for 11 movies.
What Can Go Wrong?
Don’t confuse proportions and means.
- When counting successes with a proportion, use the Normal model.
- With quantitative data (means), use Student’s t.
Beware of multimodality.
- If the histogram is not unimodal, consider separating into groups and analyzing each group separately.
Beware of skewed data.
- Look at the normal probability plot and histogram.
- Consider re-expressing if the data is skewed.
What Can Go Wrong?
Set outliers aside.
- Outliers violate the Nearly Normal Condition.
- If removing a data value substantially changes the conclusions, then you have an outlier.
- Analyze without the outliers, but be sure to include a separate discussion about the outliers.
Watch out for bias.
- With bias, even a large sample size will not save you.
What Can Go Wrong?
Make sure cases are independent.
- Look for violations of the independence assumption.
Make sure the data are from an appropriately randomized sample.
- Without randomization, both the confidence interval and the p-value are suspect.
Interpret your confidence interval correctly.
- The CI is about the mean of the population, not the mean of the sample, individuals in samples, or individuals in the population.