Quantitative Methods
Serena DeStefani – Lecture 14 – 7/30/2020
Announcements
- Let me know if you want to see the midterm
- Please return it back to me
- HW6 due today
- Datacamp due Monday
How to Define “Rare Enough”: threshold \(\alpha\)
- Need to make a decision whether P-value is low enough to reject H0 → the value is too extreme to be likely to belong to the sampling distribution
- → Set a threshold value
- This is called the alpha level (\(\alpha\)).
- P-value < \(\alpha\):
- Reject H0.
- The results are statistically significant.
- P-value > \(\alpha\):
- Fail to reject H0.
- The results are not statistically significant.
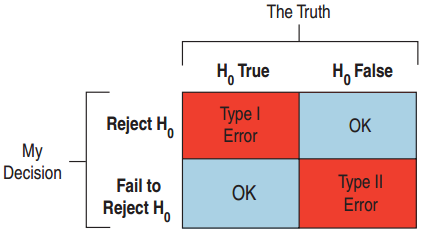
Type I and II Errors
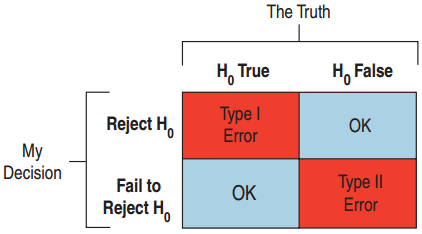
Type I Error
- Reject H0 when H0 is true.
Type II Error
- Fail to reject H0 when H0 is false.
Medicine: Such as an AIDS test
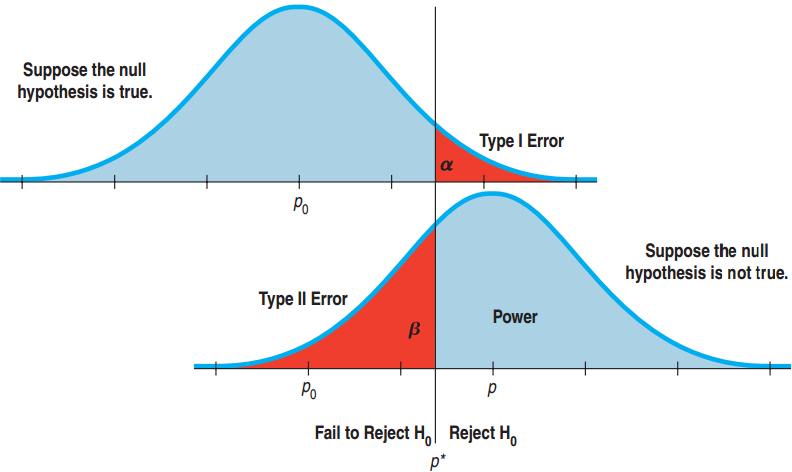
- Type I Error → False positive: Healthy person is diagnosed with the disease.
- Type II Error → False negative: Infected person is diagnosed as disease free.
Type I and II Errors
![]()
Jury Decisions
- Type I: Found guilty when the defendant is innocent. Put an innocent person in jail.
- Type II: Not enough evidence to convict, but was guilty. A murderer goes free.
Probabilities of Type I and II Errors
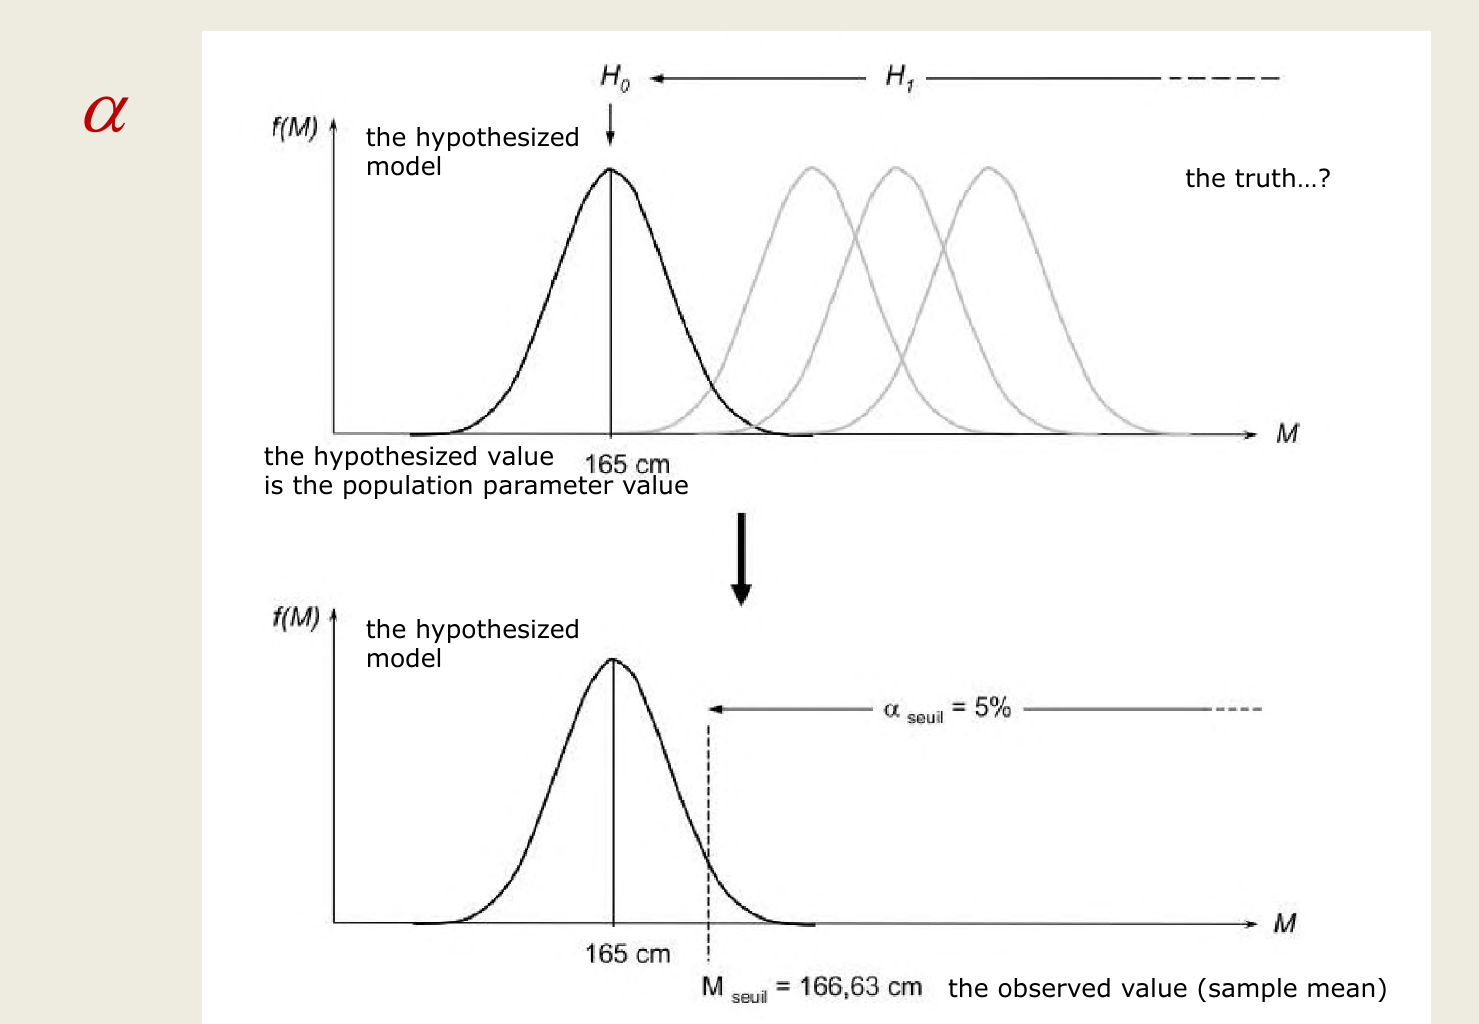
- P(Type I Error) = \(\alpha\)
- This represents the probability that if H0 is true then we will reject H0.
- P(Type II Error) = \(\beta\)
- We cannot calculate \(\beta\). Saying H0 is false does not tell us what the parameter is.
- Decreasing \(\alpha\) results in an increase of \(\beta\).
- The only way to decrease both is to increase the sample size.
Diabetes Drug Revisited
The study found patients who took the drug had an increased risk of heart attack.
- What kind of error if their findings were due to chance?
- H0 is true but they rejected H0.
- Type I error.
- Patients would be deprived of the diabetes drug’s benefits, when there is no increased risk of heart attack.
Power
The power of a test is the probability it will correctly reject H0 when H0 is false.
- If a study fails to reject H0, either
- H0 was true. No error was made.
- H0 is false. Type II error was made.
Effect Size
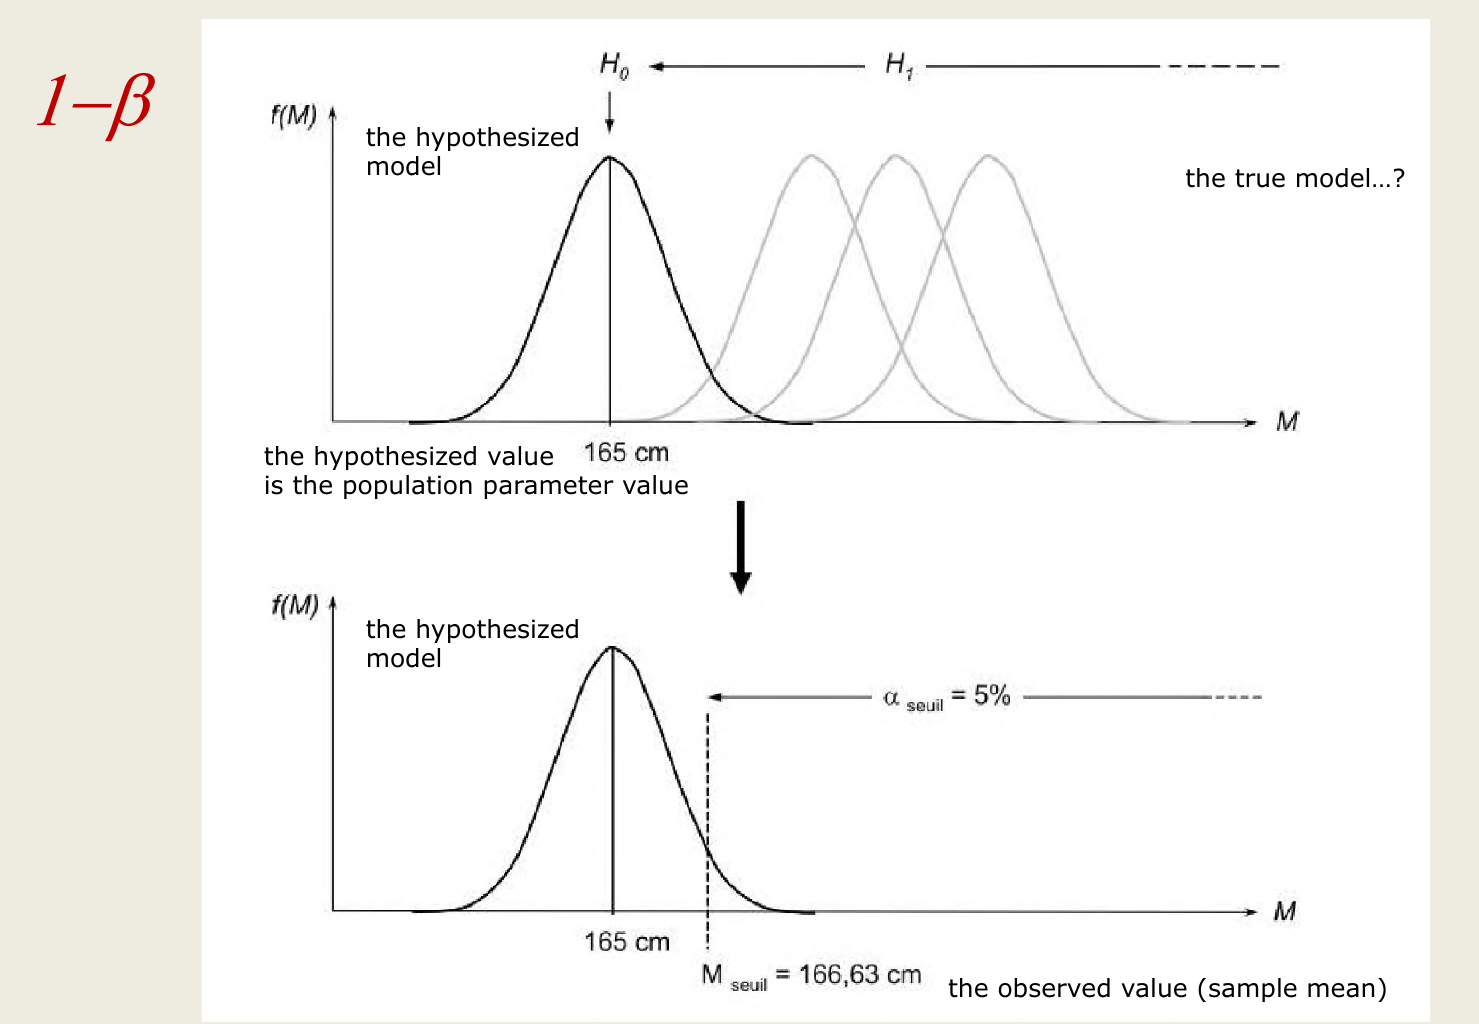
The distance between the null hypothesis (p0, the population parameter, for example) and the truth, p (the true model population parameter), is the effect size.
We don’t know the true p, so we estimate the effect size as difference between the null and the observed value.
- A small effect size is difficult to detect (high probability of Type II error)
- Power depends on effect size and standard deviation.
- “How big a difference would matter?”.
- In detecting the “human energy field” would a 53% or a 75% success rate be remarkable?
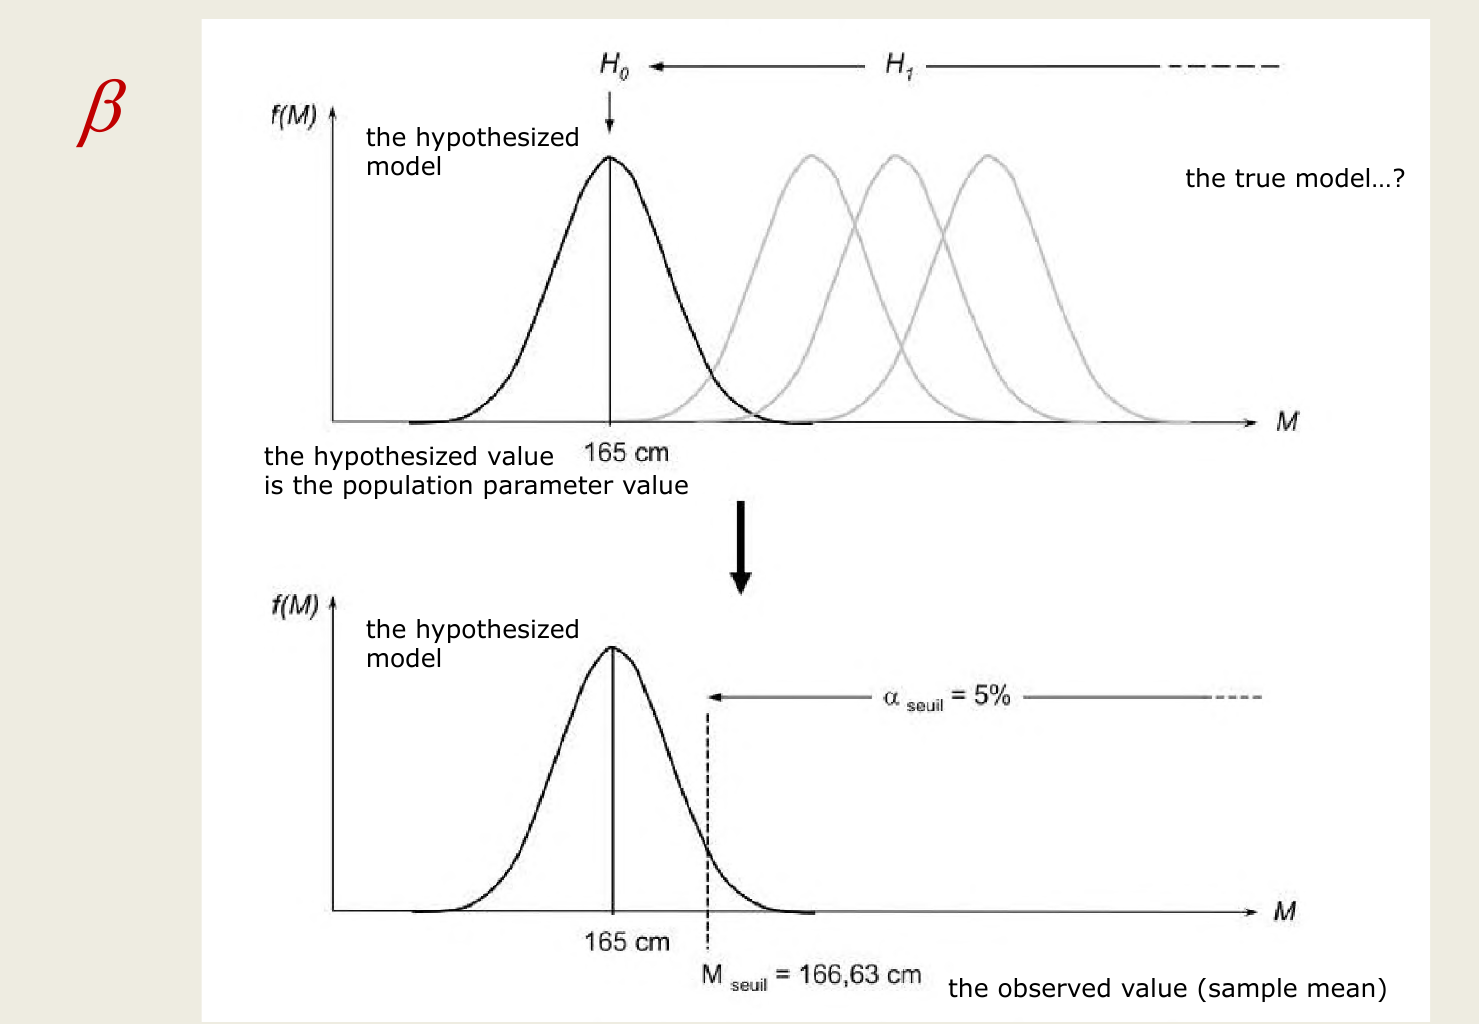
The Picture Explains It All
![]()
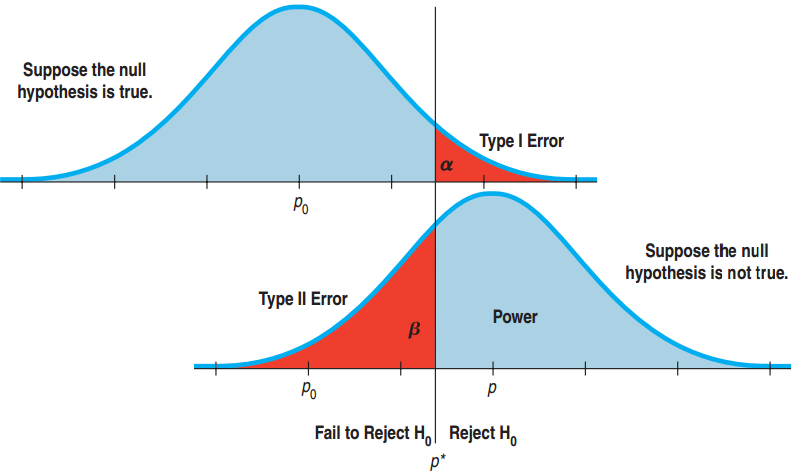
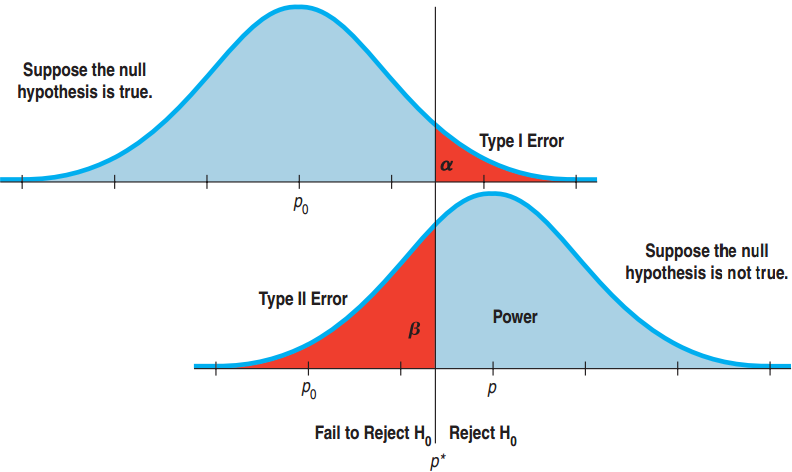
- In the top figure, if \(p_0\) is the true proportion, high \(\hat{p}\) results in a Type I error.
- In the bottom figure, if \(p\) is the true proportion, a low \(\hat{p}\) (near \(p_0\)) results in a Type II error.
What We Get from the Picture
- Power = \(1 - \beta\)
- Reducing \(\alpha\) to lower P(Type I) moves the critical value \(p^*\) to the right. This increases \(\beta\), P(Type II), and decreases the power.
- The larger difference between \(p\) and \(p_0\), the smaller the chance of Type II error and greater the power.
Reducing Both Type I and II Errors ?
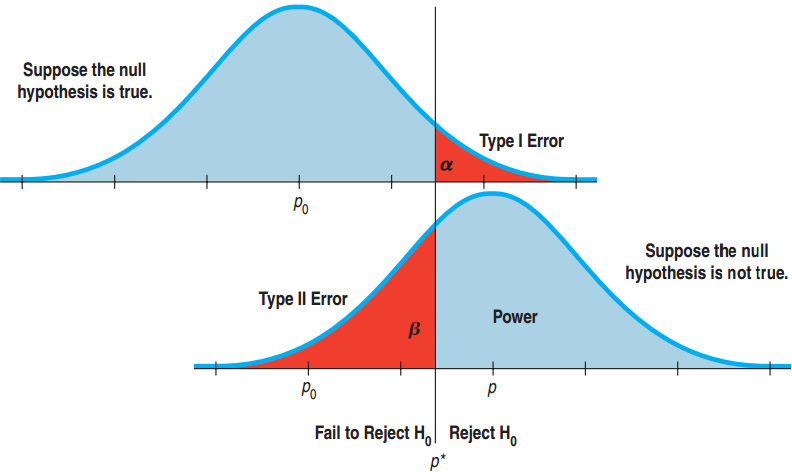
- Reducing P(Type I Error) increases P(Type II Error).
- Reducing P(Type II Error) increases P(Type I Error).
![]()
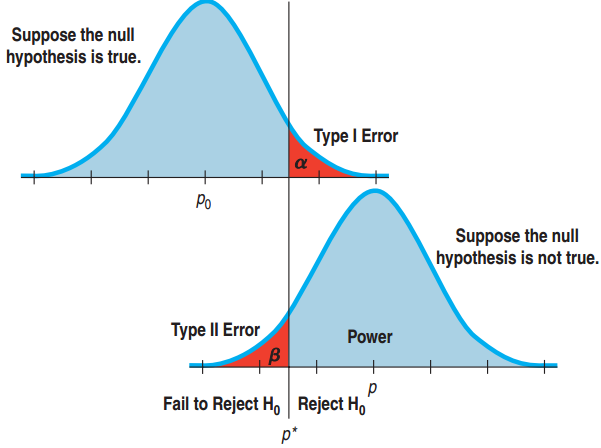
Reducing both? Increase the sample size!
- How can we reduce both?
- Increase the sample size!
- SD goes down.
- \(p^*\) moves closer to \(p_0\).
- \(\beta\) goes down.
Benefits of a Large Sample Size
The diabetes drug manufacturer looked at the study and rebutted that the sample size was too small.
- Why would this smaller study have been less likely to detect a difference in risks?
- Small studies have more sampling variability.
- Small studies have less power.
- Large studies are better but very expensive.
What Can Go Wrong?
Don’t interpret the P-value as the probability that H0 is true.
- P-Value is about data, not the hypothesis.
- It is the probability of observing data this unusual given that H0 is true.
Don’t believe too strongly in arbitrary \(\alpha\) levels.
- P-value = 0.0499 and P-value = 0.0501 are basically the same.
- Often it is better to report just the P-value.
What Can Go Wrong?
Don’t confuse practical and statistical significance.
- A large sample size makes it easy to discern a trivial change from H0.
- A small sample size can make practically significant data statistically insignificant.
Don’t forget that in spite of all your care, you might make a wrong decision.
- We can’t reduce P(Type I) and P(Type II) to 0.
“Statistics means never having to say you’re certain.”
Chapter 22
Comparing groups
22.1
The Standard Deviation of a Difference
Variance of the Differences Revisited
For independent variables X and Y
\[\text{Var}(X - Y) = \text{Var}(X) + \text{Var}(Y)\]
- The variance of the difference is larger than either.
- Many 16-ounce cereal boxes vary from box to box. If everyone pours about 2 ounces from their box, then the variance of the difference between the original and the poured amount will be more than the variance had each box been exactly 16 ounces.
- Take a square root to get
\[SD(X - Y) = \sqrt{SD(X)^2 + SD(Y)^2}\]
The Standard Deviation of the Difference Between Two Proportions
- Use subscripts to show two proportions:
\[p_1,\ q_1,\ p_2,\ q_2,\ \hat{p}_1,\ \hat{p}_2,\ n_1,\ n_2\]
The Standard Deviation of the Difference Between Two Proportions
- Use subscripts to show two proportions:
\[p_1,\ q_1,\ p_2,\ q_2,\ \hat{p}_1,\ \hat{p}_2,\ n_1,\ n_2\]
- Var(X – Y) = Var(X) + Var(Y)
\[\text{Var}(\hat{p}_1 - \hat{p}_2) =\]
The Standard Deviation of the Difference Between Two Proportions
- Use subscripts to show two proportions:
\[p_1,\ q_1,\ p_2,\ q_2,\ \hat{p}_1,\ \hat{p}_2,\ n_1,\ n_2\]
- Var(X – Y) = Var(X) + Var(Y)
\[\text{Var}(\hat{p}_1 - \hat{p}_2) = \left(\sqrt{\frac{p_1 q_1}{n_1}}\right)^2 + \left(\sqrt{\frac{p_2 q_2}{n_2}}\right)^2 = \frac{p_1 q_1}{n_1} + \frac{p_2 q_2}{n_2}\]
The Standard Deviation of the Difference Between Two Proportions
- Use subscripts to show two proportions:
\[p_1,\ q_1,\ p_2,\ q_2,\ \hat{p}_1,\ \hat{p}_2,\ n_1,\ n_2\]
\[\text{Var}(\hat{p}_1 - \hat{p}_2) = \left(\sqrt{\frac{p_1 q_1}{n_1}}\right)^2 + \left(\sqrt{\frac{p_2 q_2}{n_2}}\right)^2 = \frac{p_1 q_1}{n_1} + \frac{p_2 q_2}{n_2}\]
\[SD(\hat{p}_1 - \hat{p}_2) =\]
The Standard Deviation of the Difference Between Two Proportions
- Use subscripts to show two proportions:
\[p_1,\ q_1,\ p_2,\ q_2,\ \hat{p}_1,\ \hat{p}_2,\ n_1,\ n_2\]
\[\text{Var}(\hat{p}_1 - \hat{p}_2) = \left(\sqrt{\frac{p_1 q_1}{n_1}}\right)^2 + \left(\sqrt{\frac{p_2 q_2}{n_2}}\right)^2 = \frac{p_1 q_1}{n_1} + \frac{p_2 q_2}{n_2}\]
\[SD(\hat{p}_1 - \hat{p}_2) = \sqrt{\frac{p_1 q_1}{n_1} + \frac{p_2 q_2}{n_2}}\]
The Standard Deviation of the Difference Between Two Proportions
- Use subscripts to show two proportions:
\[p_1,\ q_1,\ p_2,\ q_2,\ \hat{p}_1,\ \hat{p}_2,\ n_1,\ n_2\]
\[\text{Var}(\hat{p}_1 - \hat{p}_2) = \left(\sqrt{\frac{p_1 q_1}{n_1}}\right)^2 + \left(\sqrt{\frac{p_2 q_2}{n_2}}\right)^2 = \frac{p_1 q_1}{n_1} + \frac{p_2 q_2}{n_2}\]
\[SD(\hat{p}_1 - \hat{p}_2) = \sqrt{\frac{p_1 q_1}{n_1} + \frac{p_2 q_2}{n_2}}\]
- Standard Error (use for CI):
\[SE(\hat{p}_1 - \hat{p}_2) = \sqrt{\frac{\hat{p}_1 \hat{q}_1}{n_1} + \frac{\hat{p}_2 \hat{q}_2}{n_2}}\]
Standard Deviation of a Difference
57% of 248 boys aged 15-17 have online profiles. 70% of 256 girls aged 15-17 have online profiles.
- What is the standard error of the difference?
- The boys and girls were selected at random, so independent
\[SE(\hat{p}_{boys}) = \sqrt{\frac{(0.57)(0.43)}{248}} \approx 0.0314 \qquad SE(\hat{p}_{girls}) = \sqrt{\frac{(0.70)(0.30)}{256}} \approx 0.0286\]
\[SE(\hat{p}_{boys} - \hat{p}_{girls}) = \sqrt{0.0314^2 + 0.0286^2} \approx 0.0425\]
\[SD(X - Y) = \sqrt{SD(X)^2 + SD(Y)^2}\]
22.2
Assumptions and Conditions for Comparing Proportions
Independence
Independence Assumption: Check
- Randomization Condition: The data are drawn independently and randomly.
- 10% Condition: If data sampled without replacement, the data represent less than 10% of the population.
Independent Groups Assumption
- The two groups are independent of each other.
- Comparing wives and husbands or before and after can give a smaller difference between SDs.
Sample size
- Successes and Failures for both ≥ 10
22.3
A Confidence Interval for the Difference Between Two Proportions
Review: Sampling Distribution for One Proportion
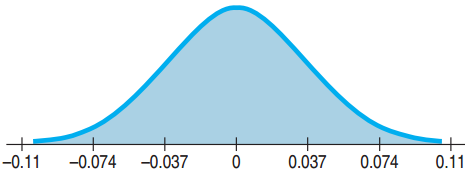
![]()
Sampling Distribution for the Difference Between Two Independent Proportions
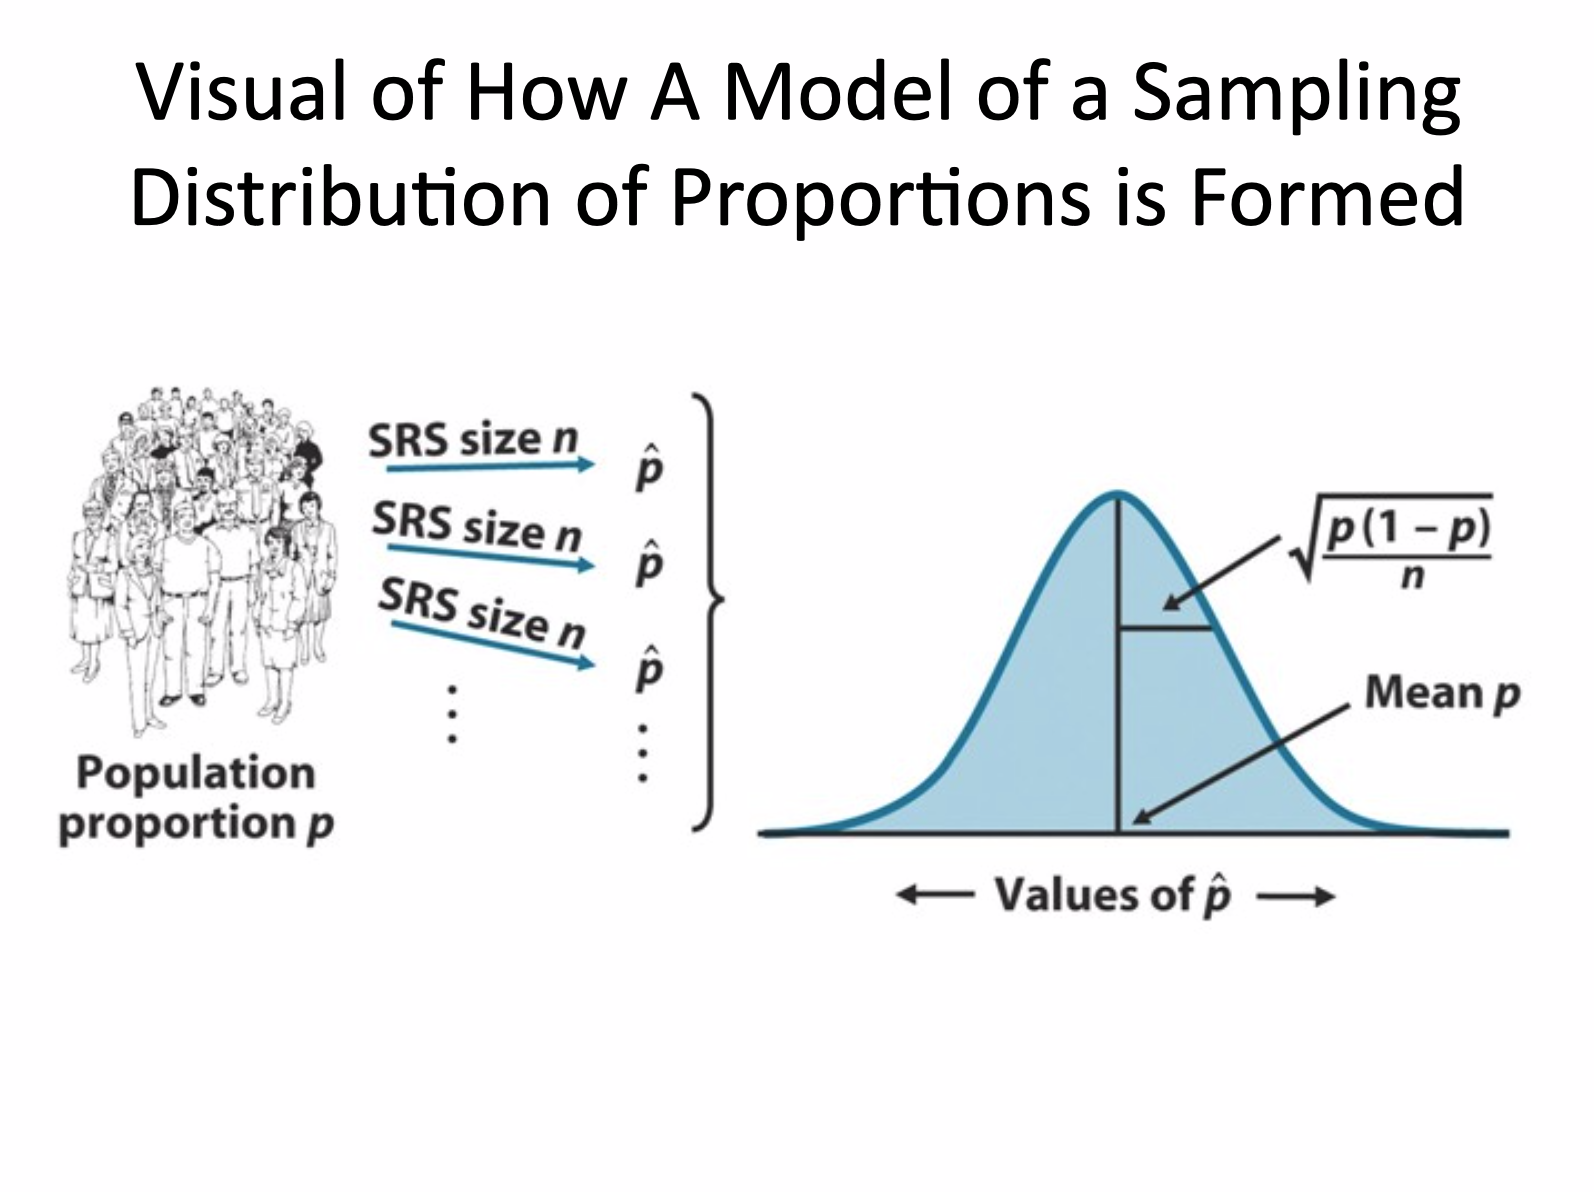
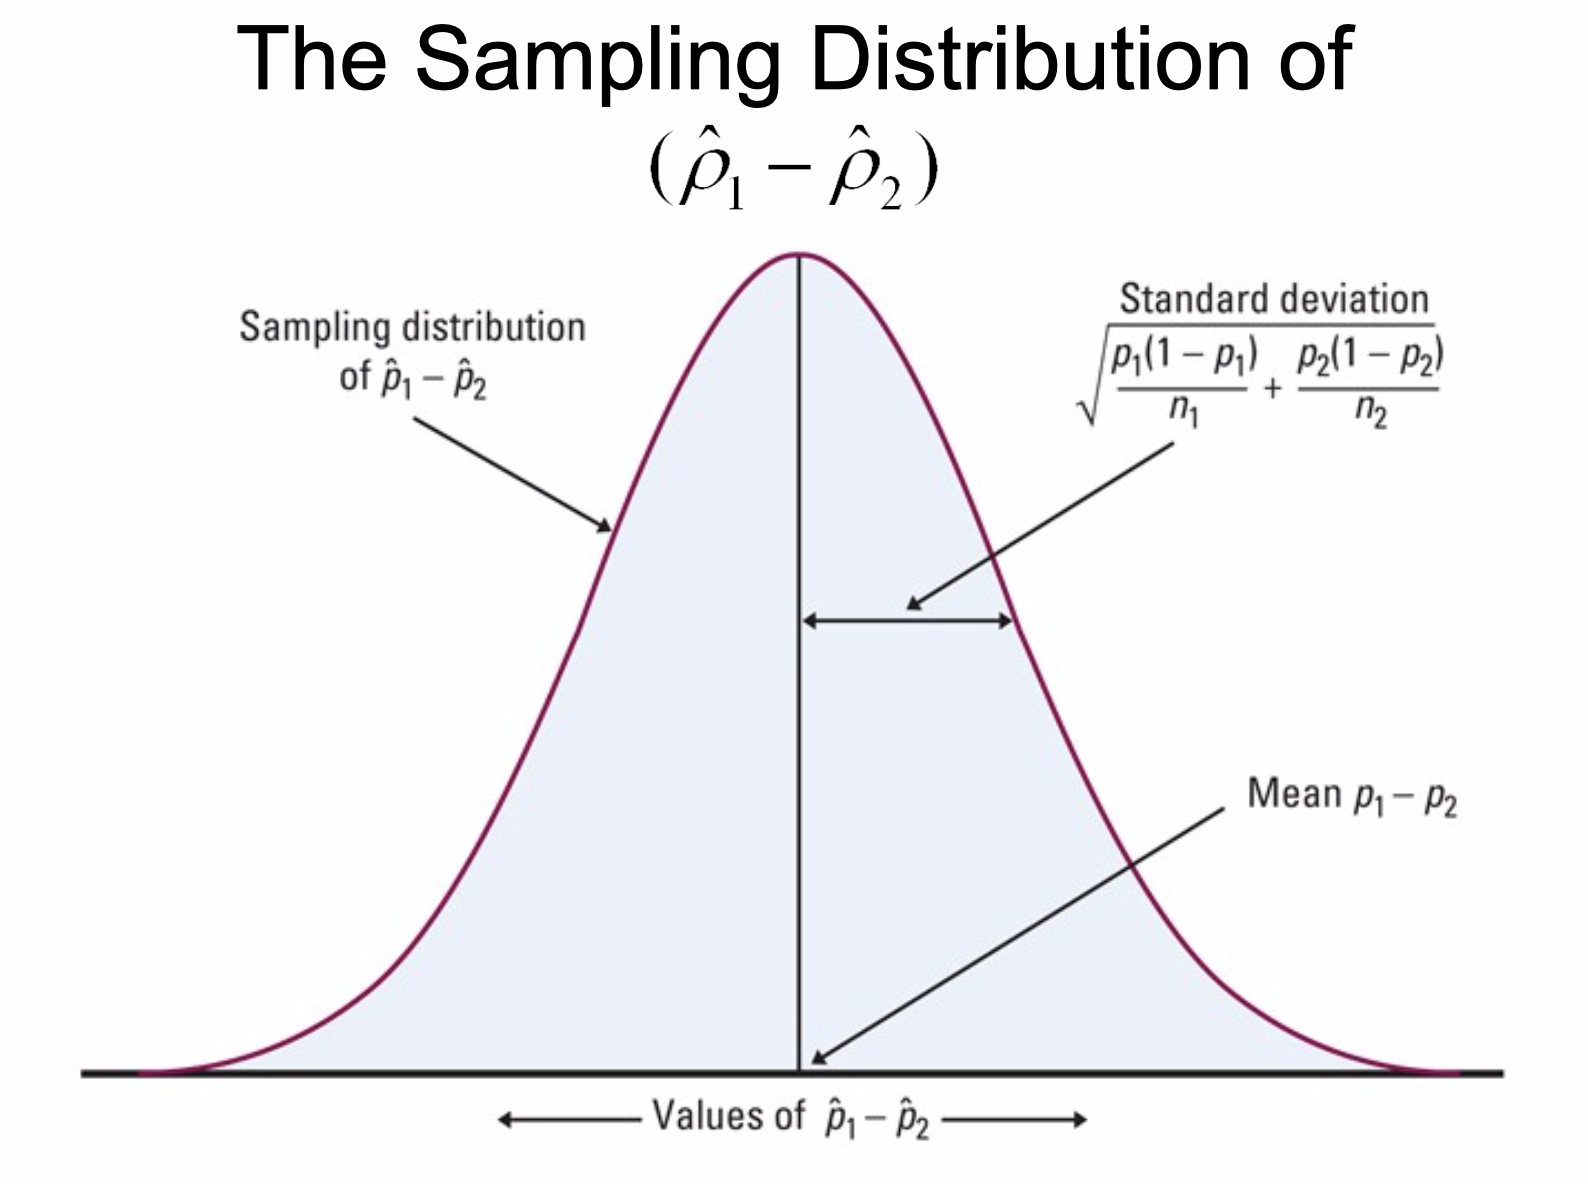
If samples are independent (individually and by groups) and the sample sizes are large, then the sampling distribution of \(\hat{p}_1 - \hat{p}_2\)
- Follows a Normal model
- Has mean \(\mu = p_1 - p_2\)
- Has standard deviation (use population proportion!)
\[SD(\hat{p}_1 - \hat{p}_2) = \sqrt{\frac{p_1 q_1}{n_1} + \frac{p_2 q_2}{n_2}}\]
Two-Proportion z-Interval
If the conditions are met, the confidence interval for \(p_1 - p_2\) is (use SE calculated with sample proportions!)
\[(\hat{p}_1 - \hat{p}_2) \pm z^* \times SE(\hat{p}_1 - \hat{p}_2)\]
\[SE(\hat{p}_1 - \hat{p}_2) = \sqrt{\frac{\hat{p}_1 \hat{q}_1}{n_1} + \frac{\hat{p}_2 \hat{q}_2}{n_2}}\]
- \(z^*\) is the critical value that corresponds to the confidence level C – you can get it from the z table
Online Presence: Boys vs. Girls
- 57% of the 248 boys had online profiles.
- 70% of the 256 girls had online profiles.
- What does the confidence interval say about the difference?
Online Presence: Boys vs. Girls
- 57% of the 248 boys had online profiles.
- 70% of the 256 girls had online profiles.
- What does the confidence interval say about the difference?
\[(\hat{p}_{girls} - \hat{p}_{boys}) \pm z^* \times SE(\hat{p}_{girls} - \hat{p}_{boys})\]
\[(0.7 - 0.57) \pm 1.96 \times 0.0425\]
\[(4.7\%,\ 21.3\%)\]
- We are 95% confident that the proportion of teen girls who post online is between 4.7% and 21.3% higher than for boys.
Wearing Seat Belts
Question: How much difference is there in the proportion of male drivers who wear seat belts when sitting next to a man and the proportion when sitting next to a woman?
- Plan: Want a 95% confidence interval for \(p_F - p_M\).
- Data are from a random sample of MA drivers.
Wearing Seat Belts
Model:
- Randomization Condition: Participants selected randomly and independently from car to car.
- 10% Condition: Sample size is less than 10% of all drivers.
- Independent Groups Assumption: The seat-belt use with male and female passengers are independent.
Wearing Seat Belts
Model:
- Success Failure Condition:
- With female passengers: 2777 wore seat belts, 1431 did not.
- With male passengers: 1363 wore seat belts, 1400 did not.
- All successes and failures ≥ 10.
- All conditions are met. Use the Normal model and find a 2-proportion z-interval.
Wearing Seat Belts
- Mechanics: \(n_F\) = 4208, \(n_M\) = 2763
- With female passengers: 2777 wore seat belts
- With male passengers: 1363 wore seat belts
Wearing Seat Belts
- Mechanics: \(n_F\) = 4208, \(n_M\) = 2763
\[\hat{p}_F = \frac{2777}{4208} \approx 0.660, \quad \hat{p}_M = \frac{1363}{2763} \approx 0.493\]
\[SE(\hat{p}_F - \hat{p}_M) = \sqrt{\frac{\hat{p}_F \hat{q}_F}{n_F} + \frac{\hat{p}_M \hat{q}_M}{n_M}} = \sqrt{\frac{(0.660)(0.340)}{4208} + \frac{(0.493)(0.507)}{2763}} \approx 0.012\]
\[ME = z^* \times SE(\hat{p}_F - \hat{p}_M) \approx 1.96 \times 0.012 \approx 0.024\]
\[\hat{p}_F - \hat{p}_M = 0.660 - 0.493 = 0.167\]
\[95\%\ \text{CI}: 0.167 \pm 0.024 = (14.3\%,\ 19.1\%)\]
Wearing Seat Belts
- Conclusion: I am 95% confident that the proportion of male drivers who wear seat belts when driving next to a female passenger is between 14.3 and 19.1 percentage points higher than the proportion who wear seat belts when driving next to a male passenger.
Caution
- Can’t generalize to other states
- Can’t say men buckle up because of the women; Lurking variables such as age may be present.
22.4
The Two Sample z-Test: Testing for the Difference Between Proportions
Internet Before Sleep
The Sleep in America Poll found that 205 of 293, or 70%, of Gen-Y use the Internet before sleep. 235 of 469, or 50%, of Gen-X use the Internet before sleep.
- Is this difference of 20% real or is it likely to be due only to natural fluctuations in the sample?
- What’s the null hypothesis?
Internet Before Sleep
The Sleep in America Poll found that 205 of 293, or 70%, of Gen-Y use the Internet before sleep. 235 of 469, or 50%, of Gen-X use the Internet before sleep.
- Is this difference of 20% real or is it likely to be due only to natural fluctuations in the sample?
- For CI:
\[SE(\hat{p}_1 - \hat{p}_2) = \sqrt{\frac{\hat{p}_1 \hat{q}_1}{n_1} + \frac{\hat{p}_2 \hat{q}_2}{n_2}}\]
- For hypothesis testing, we can do slightly better.
Pooling the Proportion
- H0 says the proportions are equal.
- To do a hypothesis test, we assume that the proportions are equal
- We should have only one value for proportion
- Total successes: 205 + 235 = 440
- Total trials: 293 + 469 = 762
- Pooled Proportion:
\[\hat{p}_{pooled} = \frac{Success_1 + Success_2}{n_1 + n_2} = \frac{440}{762} \approx 0.5774\]
Standard Error for Internet Before Sleep
The Sleep in America Poll found that 205 of 293 or 70% of Gen-Y use the Internet before sleep. 235 of 469 or 50% of Gen-X use the Internet before sleep.
Standard Error for Internet Before Sleep
The Sleep in America Poll found that 205 of 293 or 70% of Gen-Y use the Internet before sleep. 235 of 469 or 50% of Gen-X use the Internet before sleep.
\[SE_{pooled}(\hat{p}_1 - \hat{p}_2) = \sqrt{\frac{\hat{p}_{pooled}\,\hat{q}_{pooled}}{n_1} + \frac{\hat{p}_{pooled}\,\hat{q}_{pooled}}{n_2}}\]
\[= \sqrt{\frac{0.5774(1 - 0.5774)}{293} + \frac{0.5774(1 - 0.5774)}{469}} \approx 0.0368\]
Two-Proportion z-Test
- Conditions same as 2-proportion CI.
- H0: \(p_1 - p_2 = 0\)
\[\hat{p}_{pooled} = \frac{Success_1 + Success_2}{n_1 + n_2}\]
\[SE_{pooled}(\hat{p}_1 - \hat{p}_2) = \sqrt{\frac{\hat{p}_{pooled}\,\hat{q}_{pooled}}{n_1} + \frac{\hat{p}_{pooled}\,\hat{q}_{pooled}}{n_2}}\]
\[z = \frac{\hat{p}_1 - \hat{p}_2 - 0}{SE_{pooled}(\hat{p}_1 - \hat{p}_2)}\]
- The statistic follows the Normal model.
Pre-Sleep Internet Rates Differ?
- Plan: Random sample of adults: 293 Gen Y (205), 469 Gen X (235)
- Hypotheses:
- H0: \(p_{GenY} - p_{GenX} = 0\)
- HA: \(p_{GenY} - p_{GenX} \neq 0\)
- Model
- Randomization Condition: Randomly selected and stratified by sex.
Pre-Sleep Internet Rates Differ?
- Model (Continued)
- 10% Condition: Samples less than 10% of all Gen X and Gen Y.
- Independent Groups Assumption: The samples were selected at random so independent.
- Success/Failure Condition: Observed numbers of successes and failures for both groups ≥ 10.
- The conditions are all met. Use the Normal model and perform a two-proportion z-test.
Pre-Sleep Internet Rates Differ?
\[n_{GenY} = 293,\ y_{GenY} = 205,\ \hat{p}_{GenY} = 0.700\]
\[n_{GenX} = 469,\ y_{GenX} = 235,\ \hat{p}_{GenX} = 0.501\]
Pre-Sleep Internet Rates Differ?
\[n_{GenY} = 293,\ y_{GenY} = 205,\ \hat{p}_{GenY} = 0.700\]
\[n_{GenX} = 469,\ y_{GenX} = 235,\ \hat{p}_{GenX} = 0.501\]
\[\hat{p}_{pooled} = \frac{y_{GenY} + y_{GenX}}{n_{GenY} + n_{GenX}} = \frac{205 + 235}{293 + 469} \approx 0.5774\]
\[SE_{pooled}(\hat{p}_{GenY} - \hat{p}_{GenX}) = \sqrt{\frac{\hat{p}_{pooled}(1 - \hat{p}_{pooled})}{n_{GenY}} + \frac{\hat{p}_{pooled}(1 - \hat{p}_{pooled})}{n_{GenX}}}\]
\[= \sqrt{\frac{(0.5774)(0.4226)}{293} + \frac{(0.5774)(0.4226)}{469}} \approx 0.0368\]
Pre-Sleep Internet Rates Differ?
\[\hat{p}_{GenY} - \hat{p}_{GenX} = 0.700 - 0.501 = 0.199\]
\[z = \frac{(\hat{p}_{GenY} - \hat{p}_{GenX}) - 0}{SE_{pooled}(\hat{p}_{GenY} - \hat{p}_{GenX})}\]
\[= \frac{0.199}{0.0368} \approx 5.41\]
- P-value = 2 × P(z > 5.41) ≤ 0.0001
Pre-Sleep Internet Rates Differ?
- Conclusion:
- P-value ≤ 0.0001: If there really was no difference in surfing rates between the two groups, then the difference observed in this study would be very rare indeed.
- We can conclude that there is, in fact, a difference in the rate of surfing between GenY and GenX adults.
Easy to Find Teens Online: Girls vs. Boys
19% (62 girls) of 325 girls and 28% (75 boys) of 268 boys have easy to find online profiles.
- Is there a real difference between all boys and girls?
- H0: \(p_{boys} - p_{girls} = 0\)
- HA: \(p_{boys} - p_{girls} \neq 0\)
- Randomization Condition: Both samples randomly and independently chosen
- 10% Condition: Sample sizes certainly less than 10% of all boys and girls
Easy to Find Teens Online: Girls vs. Boys
- Independent Groups Assumption: The boys are independent of the girls.
- Success/Failure Condition:
- Girls: 62 successes and 263 failures.
- Boys: 75 successes and 193 failures.
- Use the two-proportion z-test.
Easy to Find Teens Online: Girls vs. Boys
\[\hat{p}_{pooled} = \frac{75 + 62}{268 + 325} \approx 0.231\]
\[SE_{pooled}(\hat{p}_{boys} - \hat{p}_{girls}) = \sqrt{\frac{0.231 \times 0.769}{268} + \frac{0.231 \times 0.769}{325}} \approx 0.0348\]
\[z = \frac{(0.28 - 0.19) - 0}{0.0348} \approx 2.59 \qquad P(z > 2.59) \approx 0.0048\]
- Two-Tailed Test: P-value = 2(0.0048) = 0.0096
- P-value very small → Reject H0
- There is strong evidence to say that there is a difference between the proportions of boys and girls who say they are easy to find online.
22.5
A Confidence Interval for the Difference Between Two Means
Difference Between Means: Standard Error
\[\text{Var}(\bar{y}_1 - \bar{y}_2) = \text{Var}(\bar{y}_1) + \text{Var}(\bar{y}_2)\]
\[SD(\bar{y}_1 - \bar{y}_2) = \sqrt{\text{Var}(\bar{y}_1) + \text{Var}(\bar{y}_2)}\]
\[SD(\bar{y}_1 - \bar{y}_2) = \sqrt{\frac{\sigma_1^2}{n_1} + \frac{\sigma_2^2}{n_2}}\]
- Don’t know the population \(\sigma\), so use the samples s:
\[SE(\bar{y}_1 - \bar{y}_2) = \sqrt{\frac{s_1^2}{n_1} + \frac{s_2^2}{n_2}}\]
Effect of Knowing How Much We Eat
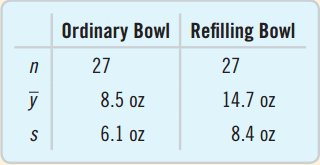
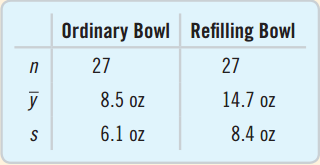
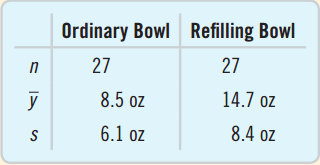
- 27 people observed eating soup from ordinary bowl.
- 27 people observed eating soup from a bowl that slowly refills without the person knowing.
- Find the standard error.
\[SE(\bar{y}_{refill} - \bar{y}_{ordinary}) = \sqrt{\frac{s_r^2}{n_r} + \frac{s_o^2}{n_o}} = \sqrt{\frac{8.4^2}{27} + \frac{6.1^2}{27}} \approx 2.0 \text{ oz.}\]
Sampling Distribution for the Difference Between Two Means
- When the assumptions are met, the sampling distribution for the difference between two independent means:
\[t = \frac{(\bar{y}_1 - \bar{y}_2) - (\mu_1 - \mu_2)}{SE(\bar{y}_1 - \bar{y}_2)} \qquad SE(\bar{y}_1 - \bar{y}_2) = \sqrt{\frac{s_1^2}{n_1} + \frac{s_2^2}{n_2}}\]
- Uses the Student’s t-model
- The degrees of freedom are complicated, so just use a computer.
Assumptions and Conditions
Independence
- Same assumptions as proportions
- Between and within groups
- Randomization is evidence of independence.
- If not independent, can you use pairing?
Nearly Normal Condition
- Same as with a single mean, but must check both.
- n < 15: must be very close to normal.
- 15 ≤ n ≤ 40: Check for outliers and skewness.
- n > 40: Fine as long as no extreme outliers or extreme skewness
Checking Conditions for Soup Experiment
- Randomization Condition: The subjects were randomly assigned.
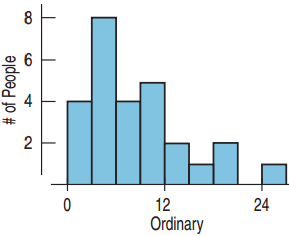
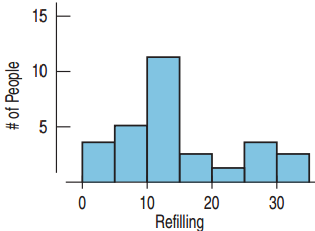
- Nearly Normal Condition: n = 27 for both. Histograms only a little skewed. No outliers.
- Independent Groups Assumption: Randomization to treatment groups guarantees this
- Okay to construct a two-sample t-interval for the difference between two means.
Two-Sample t-Interval for the Difference Between Two Means
- When the conditions are met, the confidence interval for the difference between means from two independent groups is
\[(\bar{y}_1 - \bar{y}_2) \pm t^*_{df} \times SE(\bar{y}_1 - \bar{y}_2)\]
\[SE(\bar{y}_1 - \bar{y}_2) = \sqrt{\frac{s_1^2}{n_1} + \frac{s_2^2}{n_2}}\]
Confidence Interval for Soup Experiment
- What does a 95% confidence interval say about the difference in mean amounts eaten?
\[t^*_{df} = 2.011 \text{ (by computer)}\]
Confidence Interval for Soup Experiment
- What does a 95% confidence interval say about the difference in mean amounts eaten?
\[\bar{y}_{refill} - \bar{y}_{ordinary} = 14.7 - 8.5 = 6.2\]
\[t^*_{df} = 2.011 \text{ (by computer)}\]
\[ME = t^*_{df} \times SE(\bar{y}_{refill} - \bar{y}_{ordinary}) = 2.011 \times 2.0 \approx 4.02\]
\[\text{CI}: 6.2 \pm 4.02 = (2.18,\ 10.22)\]
- I am 95% confident that people eating from a refilling bowl will eat between 2.18 and 10.22 more ounces than those eating from an ordinary bowl.
22.6
The Two-Sample t-Test: Testing for the Difference Between Two Means
Two-Sample t-Test for the Difference Between Means
- Conditions same as two-sample t-interval
- H0: \(\mu_1 - \mu_2 = \Delta_0\) (\(\Delta_0\) usually 0)
\[t = \frac{(\bar{y}_1 - \bar{y}_2) - \Delta_0}{SE(\bar{y}_1 - \bar{y}_2)} \qquad SE(\bar{y}_1 - \bar{y}_2) = \sqrt{\frac{s_1^2}{n_1} + \frac{s_2^2}{n_2}}\]
- When the conditions are met and the null hypothesis is true, use the Student’s t-model to find the P-value.
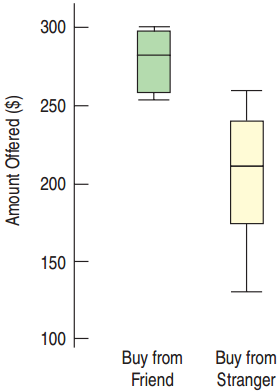
Do People Offer a Lower Price to Friends than to Strangers?
Is there a difference in the average price for a used camera people would offer a friend and a stranger?
- Plan: I have bid prices from 8 subjects buying from a friend and 7 buying from a stranger, found in a randomized experiment.
- Hypotheses
- H0: \(\mu_F - \mu_S = 0\)
- HA: \(\mu_F - \mu_S \neq 0\)
Friends vs. Strangers
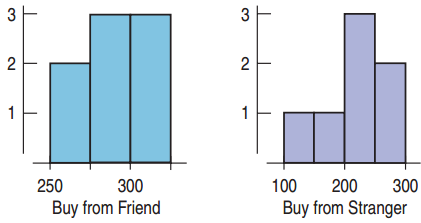
- Model: Has practical significance, but is there statistical significance?
- Randomization Condition: Subjects assigned to treatment groups randomly.
- Independent Groups Assumption: Randomizing gives independent groups.
Friends vs. Strangers
- Model (Continued):
- Nearly Normal Condition: Histograms are reasonably unimodal and symmetric, but with the very small sample sizes, we should be concerned.
- The assumptions and conditions are somewhat reasonable.
- Use the Student’s t-model to perform a two-sample t-test.
Friends vs. Strangers
\[n_F = 8,\ n_S = 7\]
\[\bar{y}_F = \$281.88,\ \bar{y}_S = \$211.43\]
\[s_F = \$18.31,\ s_S = \$46.43\]
Friends vs. Strangers
\[n_F = 8,\ n_S = 7\]
\[\bar{y}_F = \$281.88,\ \bar{y}_S = \$211.43\]
\[s_F = \$18.31,\ s_S = \$46.43\]
\[SE(\bar{y}_F - \bar{y}_S) = \sqrt{\frac{18.31^2}{8} + \frac{46.43^2}{7}} \approx 18.70\]
\[\bar{y}_F - \bar{y}_S = 281.88 - 211.43 = \$70.45\]
\[t = \frac{70.45}{18.70} \approx 3.77\]
\[\text{P-value} = 2 \times P(t > 3.77) = 0.006\]
Friends vs. Strangers
- Conclusion: The P-value = 0.006 is very small.
- If there were no difference in the mean prices, then a difference this large would occur 6 times in 1000.
- Too rare to believe
- Reject H0.
- Conclude that people are likely, on average, to offer a friend more than they’d offer a stranger for a used camera.
Difference in Donations Based on Images?
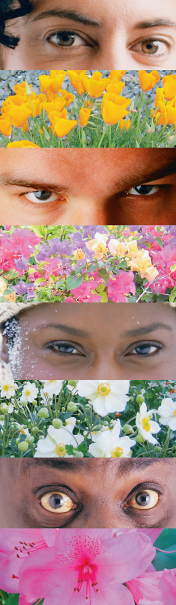
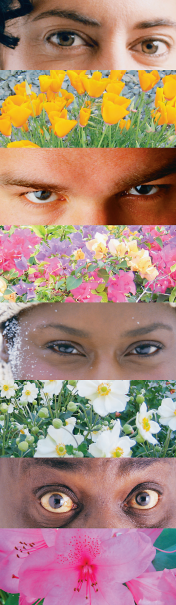
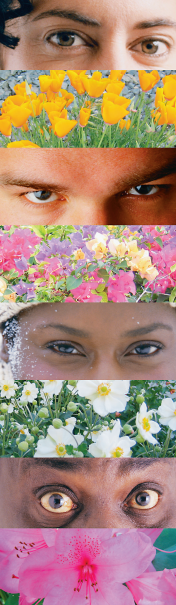
The cupboard next to the coffee station’s voluntary honesty box had alternating pictures of eyes and flowers each week.
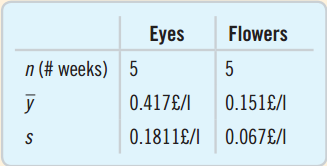
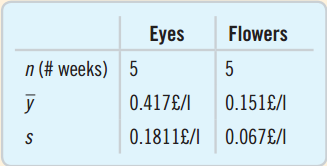
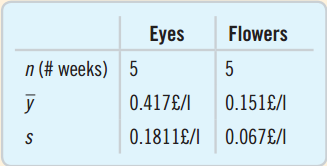
- Do these results provide evidence of a difference in mean donation when the eyes are shown and when the flowers are shown? Measured # pounds collected per liter of milk
Eyes vs. Flowers?
- H0: \(\mu_{eyes} - \mu_{flowers} = 0\)
- HA: \(\mu_{eyes} - \mu_{flowers} \neq 0\)
- Independence Assumption: The study is observational not randomized, but independence is probably true.
- Nearly Normal Condition: This should be checked.
- Independent Groups Assumption: Week-to-week independence is plausible.
- Do a two-sample t-test for the difference.
Eyes vs. Flowers
![]()
Eyes vs. Flowers
\[SE(\bar{y}_{eyes} - \bar{y}_{flowers}) = \sqrt{\frac{0.1811^2}{5} + \frac{0.067^2}{5}} \approx 0.0864\]
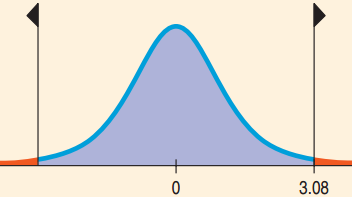
\[t = \frac{0.417 - 0.151}{0.0864} = 3.08\]
\[\text{P-value} = 2 \times P(t > 3.08) = 0.027\]
Eyes vs. Flowers?
- Assuming normal distributions, with P-value = 0.027, I will reject the null hypothesis.
- This study provides evidence that there is a difference in the mean amount of money people donate at the coffee station when there are flowers and when there are “eyes watching.”
22.7
The Pooled t-Test: Everyone Into the Pool?
Pooling
If the variances are equal, we can use pooling.
- Advantages of Pooling
- Can have more degrees of freedom than two sample t-test.
- More degrees of freedom gives a higher power.
- Disadvantage of Pooling
- The assumption of equal variances is difficult to establish and often false.
Pooled Variance and Standard Error
\[s^2_{pooled} = \frac{(n_1 - 1)s_1^2 + (n_2 - 1)s_2^2}{(n_1 - 1) + (n_2 - 1)}\]
\[SE_{pooled} = \sqrt{\frac{s^2_{pooled}}{n_1} + \frac{s^2_{pooled}}{n_2}} = s_{pooled}\sqrt{\frac{1}{n_1} + \frac{1}{n_2}}\]
Pooled t-Test and Confidence Interval for Means
- Conditions same as two-sample t-interval/test plus the variances must be equal.
- H0: \(\mu_1 - \mu_2 = \Delta_0\) (\(\Delta_0\) usually 0)
\[t = \frac{(\bar{y}_1 - \bar{y}_2) - \Delta_0}{SE_{pooled}(\bar{y}_1 - \bar{y}_2)} \qquad SE(\bar{y}_1 - \bar{y}_2) = s_{pooled}\sqrt{\frac{1}{n_1} + \frac{1}{n_2}}\]
\[s^2_{pooled} = \frac{(n_1 - 1)s_1^2 + (n_2 - 1)s_2^2}{(n_1 - 1) + (n_2 - 1)}\]
Pooled t-Test and Confidence Interval for Means (Continued)
- When the conditions are met and the null hypothesis is true, use the Student’s t-model with \((n_1 - 1) + (n_2 - 1)\) degrees of freedom.
- Use the model to find the P-value or margin of error.
- The CI is \((\bar{y}_1 - \bar{y}_2) \pm t^*_{df} \times SE_{pooled}(\bar{y}_1 - \bar{y}_2)\).
- df = \((n_1 - 1) + (n_2 - 1)\)
- The \(t^*\) depends on the confidence level.
When to Use the Pooled t-Test
- The pooled t-test has almost no advantage over the independent sample t-test.
- A great disadvantage is that the pooled t-test is very poor when the standard deviations are not the same.
- Avoid this test unless you are very certain that the variances (standard deviations) are the same.
What Can Go Wrong?
Don’t use two-sample methods when the samples aren’t independent.
- Random sampling is best.
- Consider matched-pairs design for dependent data.
Look at the plots.
- Boxplots, histograms, and normal plots will help you determine if the Near Normal Condition is met.
- A strong outlier can completely change the conclusions.
What Can Go Wrong?
Be cautious if you apply inference methods where there was no randomization.
- Without randomization, the inferences about the differences may be wrong.
Don’t interpret a significant difference in proportions or means causally.
- People with higher incomes are more likely to snore.
- Will surgery to prevent snoring make you rich?
- Maybe the lurking variable, age, causes both.
Announcements
- Let me know if you want to see the midterm
- Please return it back to me
- HW6 due today
- Datacamp due Monday