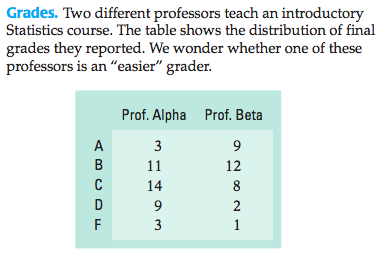
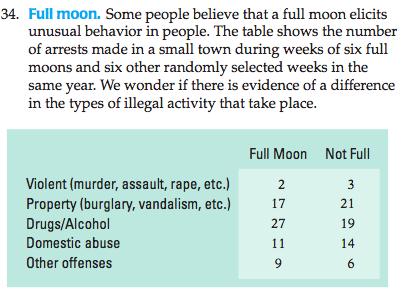
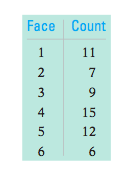
Same format as HWs, focus on inference (no CH 15/16)
Problems (can be both tests and CIs) on inference for means, proportions, regression, one chi-square test, and questions about Analysis of Variance (I will give you the ANOVA table)
Chapter 24
Comparing Counts
24.1
Goodness-of-Fit Test
Finding Expected Counts
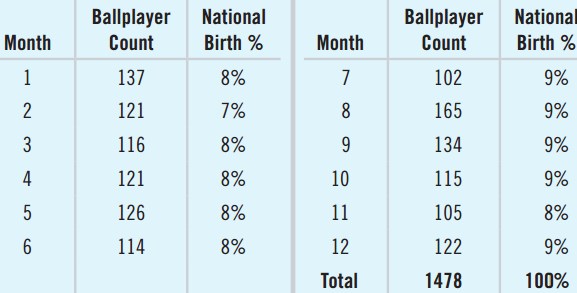
1478 baseball players’ birth months.
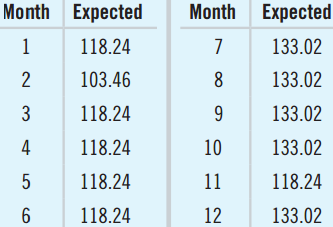
Find the expected count for each month.
. . .
January: 1478 × 0.08 = 118.24
February: 1478 × 0.07 = 103.46
Assumptions and Conditions
Counted Data Condition
The values in each cell are counts.
Doesn’t work with percents, proportions, or measurements
Independence Assumption
The counts in each cell must be independent of each other.
For random samples, we can generalize to the entire population.
Assumptions and Conditions (Continued)
Sample Size Assumption
Expected counts for each cell ≥ 5.
This is called the Expected Cell Frequency Condition.
If the assumptions and conditions are met, we can perform a Chi-Square Test for Goodness-of-Fit.
Chi-Square Calculations
Interested in difference between observed and expected: residuals.
Make positive by squaring them all.
Get relative sizes of the residuals by dividing them by the expected counts.
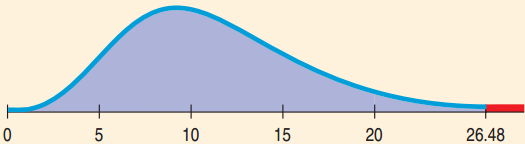
There’s evidence that major league ballplayers’ birth months have a different distribution from the rest of us.
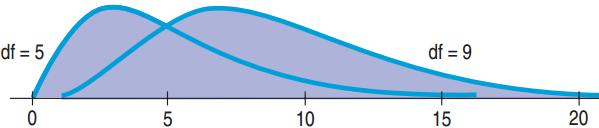
Why so big? The Shape of \(\chi^2\)
With df large (more cells), the weighted residuals add up quickly → numerator gets bigger \(\small\chi^2 = \sum \frac{(Obs - Exp)^2}{Exp}\)
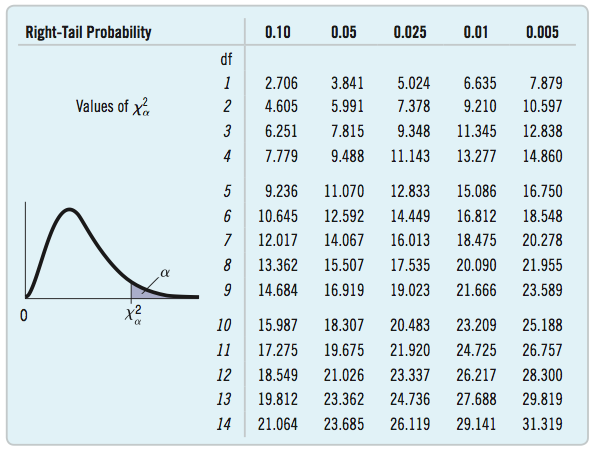
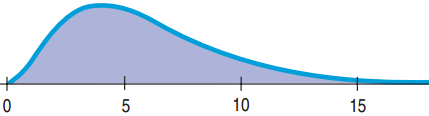
Unlike z or t, a larger \(\chi^2\) is more common. It all depends on the df: look at value 10
The mode of \(\chi^2\) is df – 2.
The expected value of \(\chi^2\) is df, to the right of the mode due to the right skewed distribution.
The CEO curve had df = 11, peaks at 9 and mean = 11
24.2
Chi-Square Test for Homogeneity
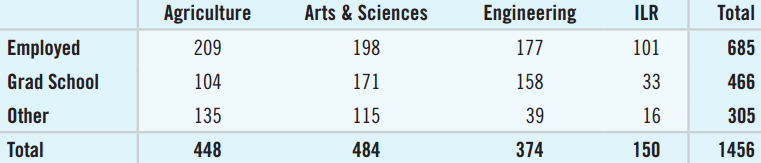
Activities of Graduates at Different Colleges
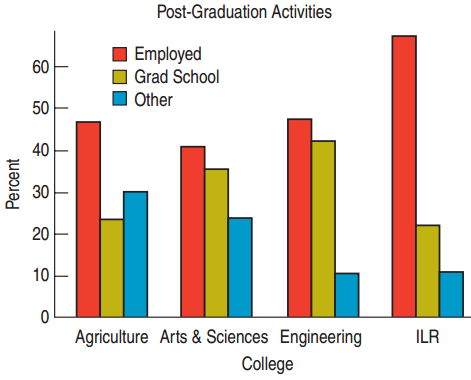
Are graduates’ activities the same at different colleges within the same university?
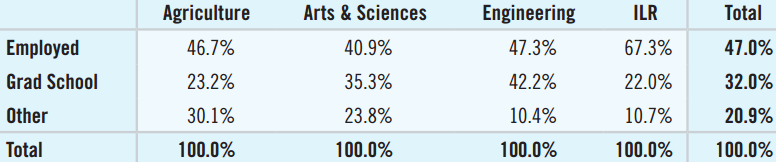
Class-size differences cloud the table. Proportions may be helpful.
Test for Homogeneity
More than two proportions to compare, so we cannot use the two-proportion z-test.
Generalize to the chi-square test for homogeneity.
Same mechanics as goodness-of-fit, different hypotheses and conclusions.
Chi-square test for homogeneity asks if the distribution is the same for different groups.
The test looks for differences large enough to step beyond what we might expect from random sample-to-sample variation
Assumptions and Conditions
Same as Goodness-of-Fit
Counted Data Condition: Always use counts, not proportions, percents, or measurements.
Independence Assumption: Need randomization to generalize to the population.
Expected Cell Frequency Condition: All expected counts should be at least 5.
Calculations
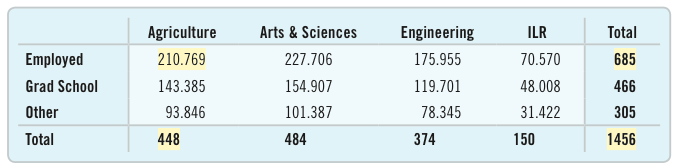
Expected Counts?
685, or about 47.0%, of the 1456 students who responded to the survey were employed.
Of the 448 agriculture students, expect 47% of 448 or 210.76 to be employed.
\(\chi^2\) Calculation
Use the same formula with these observed and expected. df = (R – 1)(C – 1) = (3 – 1)(4 – 1) = 6.
Students’ Choices Same Across Colleges?
Plan: I have a table of counts from the college’s class of 2011.
Hypotheses:
H0: Students’ post-graduation activities are distributed in the same way for all four colleges.
HA: Students’ plans do not have the same distribution.
Students’ Choices Same Across Colleges?
Model: The bar chart shows how the percents differ.
Counted Data Condition: I will use the table of counts.
Independence Assumption: It is not a random sample, but with this large study, most students act independently of the others.
Expected Cell Frequency Condition: All ≥ 5
Use the \(\chi^2\)-model with df = 6 and do a chi-square test for homogeneity.
Students’ Choices Same Across Colleges?
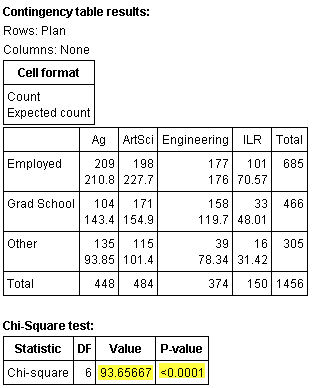
Mechanics: I used the computer to produce the expected counts, \(\chi^2\), and P-value.
\(\chi^2 \approx 93.66\)
P-value < 0.0001
Students’ Choices Same Across Colleges?
Conclusion: The P-value is very small, so I reject the null hypothesis.
I conclude that there’s evidence that the post-graduation activities of students from these four colleges don’t have the same distribution.
24.3
Examining the Residuals
Examining the Residuals
After rejecting H0, we wonder where things differed.
The residuals can be helpful.
Even better, standardized residuals:
\[c = \frac{Obs - Exp}{\sqrt{Exp}}\]
Standardized residuals are like z-scores.
Tells us how far the observed is above or below the expected.
Standardized Residuals for College Grads
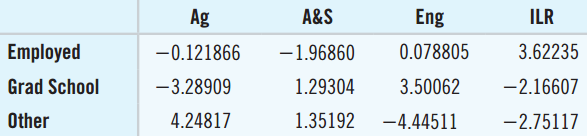
Engineering students: c is big, far from the expected value
→ They disproportionately go to grad school and do not pursue other activities.
Agriculture students disproportionately pursue other activities.
24.4
Chi-Square Test of Independence
Hepatitis and Tattoos
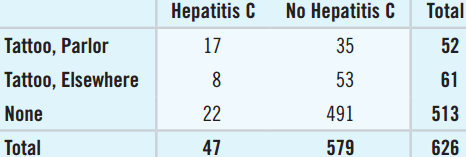
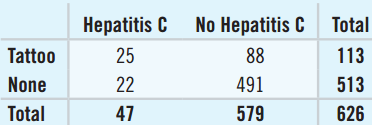
The contingency table shows the results of a study that looked at where people had their tattoo and whether they have Hepatitis C.
Two categorical variables
Contingency tables are used to see if one categorical variable is contingent on another.
Are Hepatitis C and Tattoo Status independent?
Independence
Two events are independent if P(A|B) = P(A).
If Tattoo Status and Hepatitis C are independent, we would expect the proportions of “positive” to be the same for the three levels of Tattoo Status.
Same criterion as homogeneity
The nuances of homogeneity and independence statements are different.
Same distribution vs. independent
Assumptions and Conditions
Counted Data Condition: Always use counts, not proportions, percents, or measurements.
Independence Assumption: The data were collected independently.
Expected Cell Frequency Condition: All expected counts at least 5.
10% Condition: Data come from a random sample of less than 10% of the population.
Tattoos and Hepatitis
Model: (Continued)
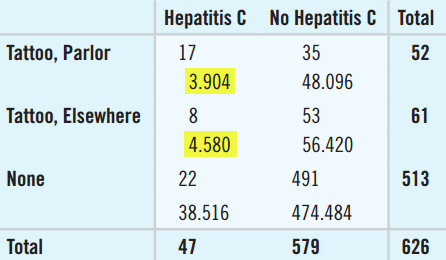
Expected Cell Frequency Condition: Two expected counts < 5.
Not all the assumptions are met, but I will carefully go ahead with the chi-square test for independence with df = (3 – 1) × (2 – 1) = 2. I will check the residuals carefully.
Tattoos and Hepatitis C
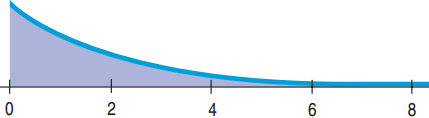
Mechanics: With df = 2 the \(\chi^2\) graph looks very different.
Use computer just like with Homogeneity.
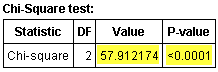
\(\chi^2\) = 57.91, P-value < 0.0001
Tattoos and Hepatitis C
Conclusion: With P-value < 0.0001, reject H0. Tattoo Status and Hepatitis Status are not independent.
Since the expected counts are < 5, I need to check that the cells with small expected counts did not influence the results too greatly.
Examining the Residuals
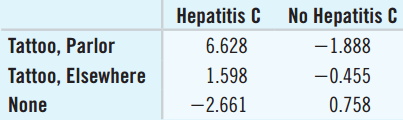
Parlor/Hepatitis C residual is large positive. More Hepatitis C from those with tattoos from parlors than expected.
None/Hepatitis C residual large negative. Less Hepatitis C from those without tattoos than expected.
Cell counts small for Parlor/Hepatitis C. We should report this as a warning, or rethink the data.
How can we increase cell counts?
Combining Groups
Combining all those with tattoos gives large enough counts.
New \(\chi^2\) = 42.42 (df = 1)
New P-value < 0.0001
We conclude that Tattoo Status and Hepatitis C Status are not independent.
We are concerned, but need more evidence to suggest that tattoo parlors are a problem.
Race and Traffic Stops
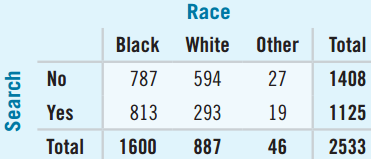
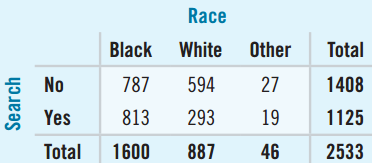
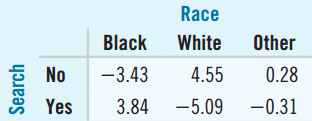
Data were collected on drivers’ race and whether they were searched when an officer stopped them.
What test to decide if race is a factor in vehicle searches?
Two categorical variables: Race and Search.
Chi-Square test for independence.
H0: Race and Search are independent.
HA: Race and Search are not independent.
Chi-Square Mechanics
Find the df, expected frequency for Black drivers who were stopped, that cell’s component of \(\chi^2\), and its residual.
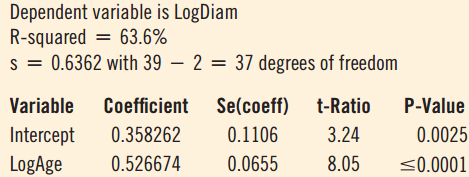
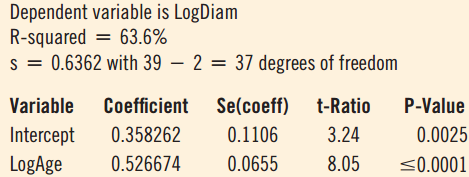
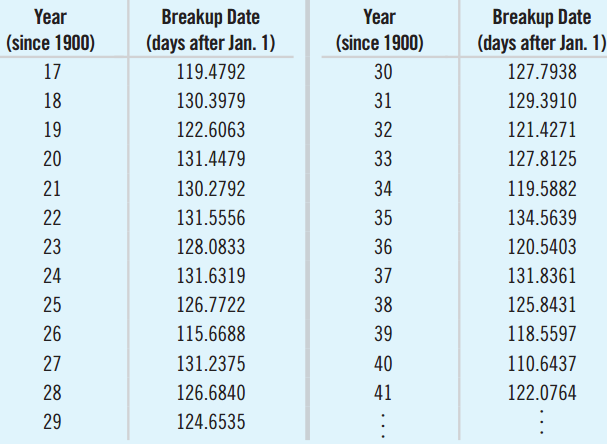
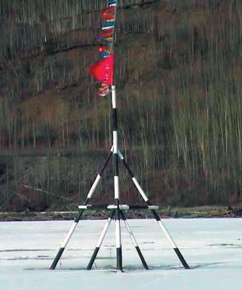
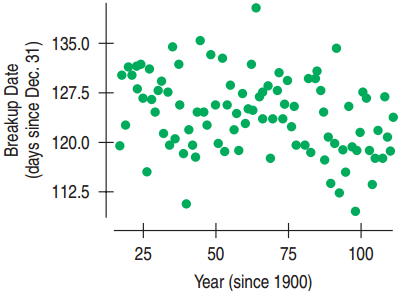
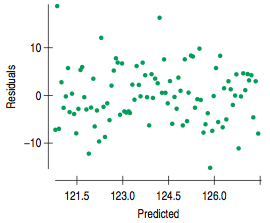
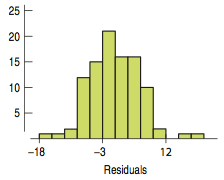
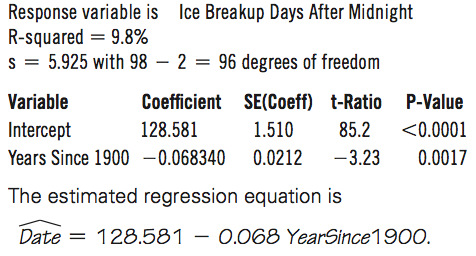
Conclusion: P-value = 0.0017, the association is unlikely to occur by chance, even though R-squared is weak. There is strong evidence the ice breakup is occurring earlier.
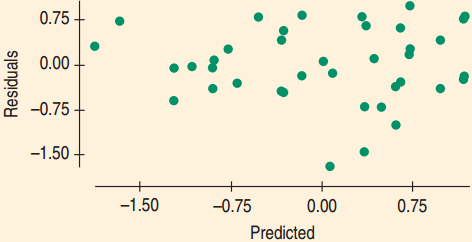
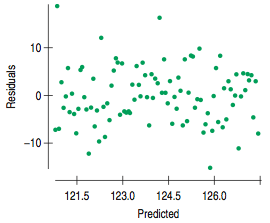
Oscillation of residuals raised concerns.
Ice Breakup Date Per Year
Create a Confidence Interval for the Slope
– 0.068 ± (1.985)(0.0212) = (– 0.11, – 0.03)
Interpretation: I am 95% confident that the ice has been breaking up, on average, between 0.03 days (about 40 minutes) and 0.11 days (about 3 hours) earlier each year since 1917.
What is Causing the Early Ice Breakup?
Based on the regression conclusions can we say that global warming is causing the early ice breakup?
No! Causation cannot be concluded from association.
Maybe it is global warming.
Maybe it is from the area’s human activities warming up the water below.
25.5
Standard Errors for Predicted Values
Two Prediction Questions
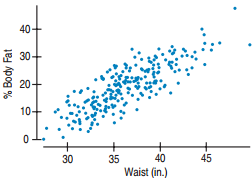
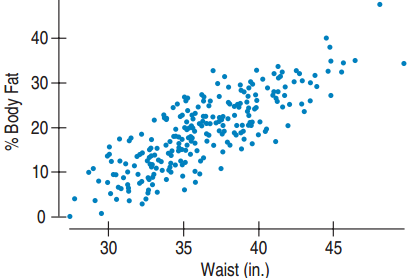
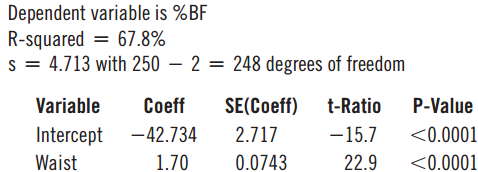
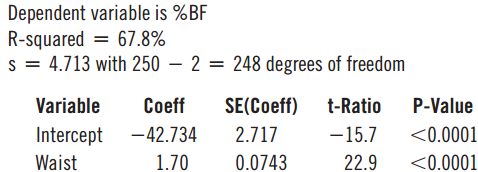
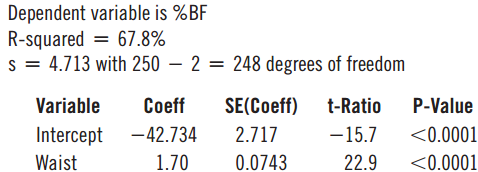
Predict the %Body Fat of a man with waist 38 in.
Notice the prediction is for a single man.
Predict the mean %Body Fat for all men with waist 38 in.
This prediction is for a mean.
Both have the same prediction: \(\ \hat{y}_\nu = b_0 + b_1 x_\nu\)
The confidence intervals: \(\ \hat{y}_\nu \pm t^*_{n-2} \times SE\)
There is a 95% chance that this interval captures the true %Body Fat of a randomly selected man with a 38-inch waist.
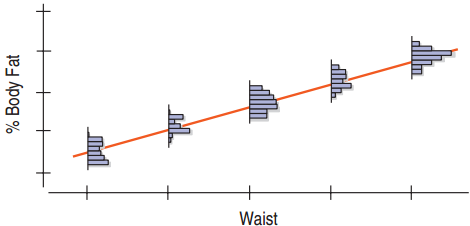
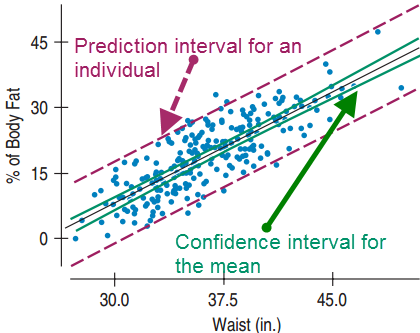
Visualizing the Two Intervals
The prediction interval for the individual is much wider than the confidence interval for the mean.
What Can Go Wrong?
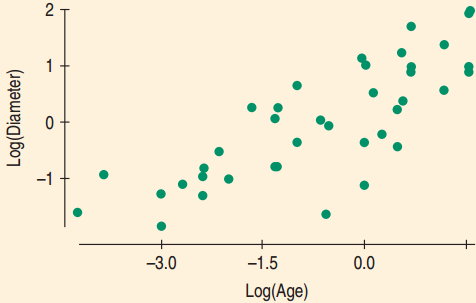
Don’t fit a linear regression to data that aren’t straight.
Stop here or try re-expressing if not straight.
Watch out for the plot thickening.
If the points fan out, then the standard deviations are not constant. Don’t perform regression analysis.
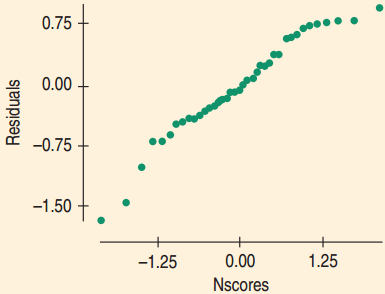
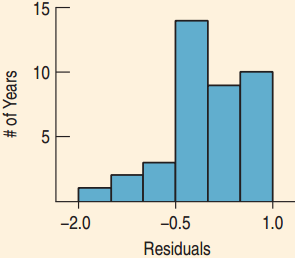
Make sure the errors are Normal.
Check the histogram and normal probability plot. Need Normal to invoke the CLT.
What Can Go Wrong?
Watch out for extrapolation.
The model can fail for x-values that are far from the mean of the x’s.
Watch out for influential points and outliers.
Like other analyses, regression can be strongly influenced by outliers.
Watch out for one-tailed tests.
Software conducts two-tailed tests for regression. If you need one tail, divide the P-value by 2.
Chapter 28
Multiple Regression
28.1
What is Multiple Regression?
Just Do It
The method of least squares can be expanded to include more than one predictor. The method is known as multiple regression.
For simple regression we found the Least Squares solution, the one whose coefficients made the sum of the squared residuals as small as possible.
For multiple regression, we’ll do the same thing, but this time with more coefficients.
Just Do It (cont.)
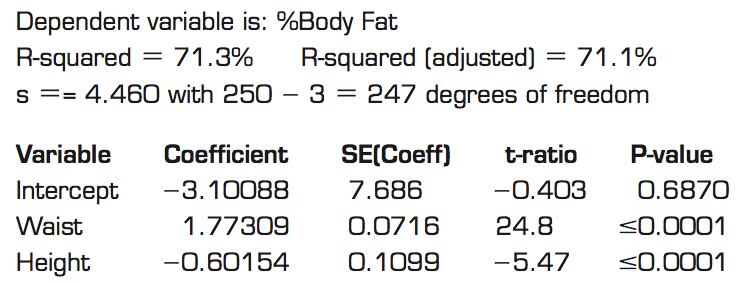
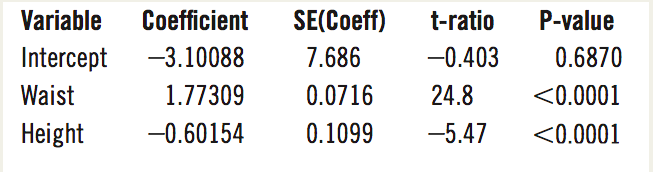
You should recognize most of the numbers in the following example (%body fat) of a multiple regression table. Most of them mean what you expect them to.
So What’s New?
The meaning of the coefficients in the regression model has changed in a subtle but important way.
Multiple regression is an extraordinarily versatile calculation, underlying many widely used Statistics methods.
Multiple regression offers our first glimpse into statistical methods that use more than two quantitative variables.
28.2
Interpreting Multiple Regression Coefficients
What Multiple Regression Coefficients Mean
We said that height might be important in predicting body fat in men.
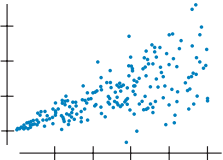
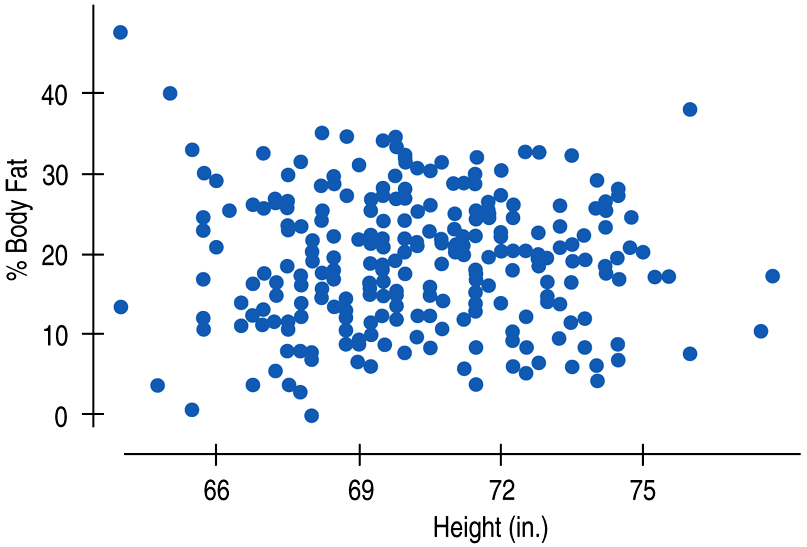
What’s the relationship between %body fat and height in men? Here’s the scatterplot:
What Multiple Regression Coefficients Mean (cont.)
It doesn’t look like height tells us much about %body fat. Or does it?
The coefficient of height in the multiple regression model was statistically significant, so it did contribute to the multiple regression model.
How can this be?
The multiple regression coefficient of height takes account of the other predictor (waist size) in the regression model.
What Multiple Regression Coefficients Mean (cont.)
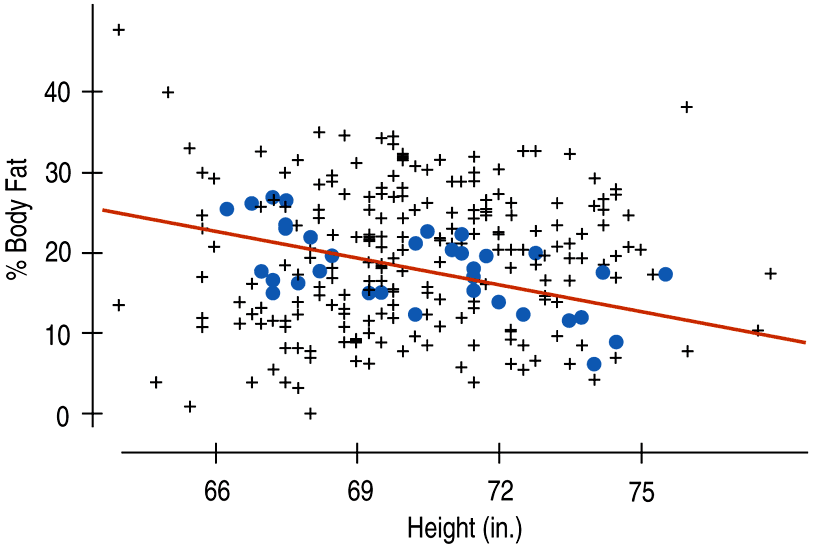
For example, when we restrict our attention to men with waist sizes between 36 and 38 inches (points in blue), we can see a relationship between %body fat and height:
What Multiple Regression Coefficients Mean (cont.)
So, overall there’s little relationship between %body fat and height, but when we focus on particular waist sizes there is a relationship.
This relationship is conditional because we’ve restricted our set to only those men with a certain range of waist sizes.
For men with that waist size, an extra inch of height is associated with a decrease of about 0.60% in body fat.
If that relationship is consistent for each waist size, then the multiple regression coefficient will estimate it.
What Multiple Regression Coefficients Mean (cont.)
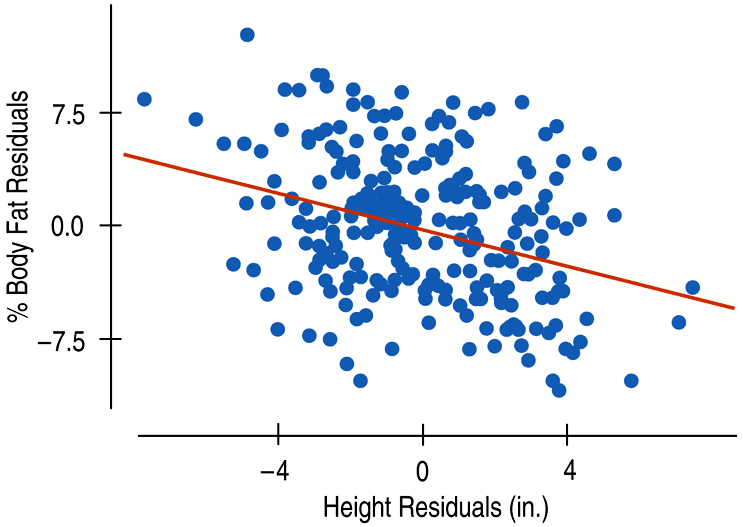
The following partial regression plot shows the coefficient of height in the regression model has a slope equal to the coefficient value in the multiple regression model:
28.3
The Multiple Regression Model - Assumptions and Conditions
The Multiple Regression Model
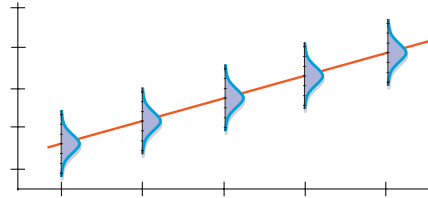
For a multiple regression with k predictors, the model is:
The assumptions and conditions for the multiple regression model sound nearly the same as for simple regression, but with more variables in the model, we’ll have to make a few changes.
Assumptions and Conditions
Linearity Assumption:
Straight Enough Condition: Check the scatterplot for each candidate predictor variable – the shape must not be obviously curved or we can’t consider that predictor in our multiple regression model.
Independence Assumption:
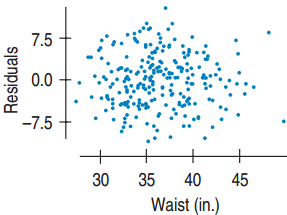
Randomization Condition: The data should arise from a random sample or randomized experiment. Also, check the residuals plot - the residuals should appear to be randomly scattered.
Assumptions and Conditions (cont.)
Equal Variance Assumption:
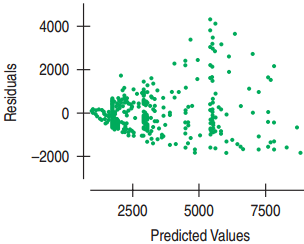
Does the Plot Thicken? Condition: Check the residuals plot – the spread of the residuals should be uniform.
Assumptions and Conditions (cont.)
Normality Assumption:
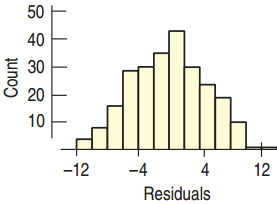
Nearly Normal Condition: Check a histogram of the residuals – the distribution of the residuals should be unimodal and symmetric, and the Normal probability plot should be straight.
Assumptions and Conditions (cont.)
Summary of the checks of conditions in order:
Check the Straight Enough Condition with scatterplots of the y-variable against each x-variable.
If the scatterplots are straight enough, fit a multiple regression model to the data.
Find the residuals and predicted values.
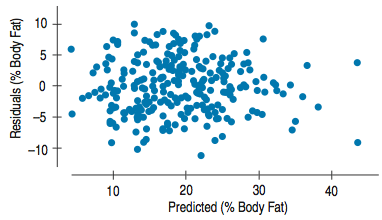
Make and check a scatterplot of the residuals against the predicted values. This plot should look patternless.
Assumptions and Conditions (cont.)
Summary of the checks of conditions in order:
Think about how the data were collected. Randomization? Representative? Plot residuals against time - patterns?
If the conditions check out this far, feel free to interpret the regression model and use it for prediction.
If you wish to test hypotheses about the coefficients or about the overall regression, then make a histogram and Normal probability plot of the residuals to check the Nearly Normal Condition.
Example: Multiple Regression Step-By-Step
How should we model %Body Fat in terms of Height and Waist size?
Example: Multiple Regression Step-By-Step
Variables – Name the variables, report the W’s, and specify the questions of interest:
Have body measurements on 250 adult males from BYU Human Performance Research Center.
Want to understand relationship between %Body Fat, Height, and Waist size.
Example: Multiple Regression Step-By-Step
Plan – Think about the assumptions and check the conditions.
Straight Enough Condition:
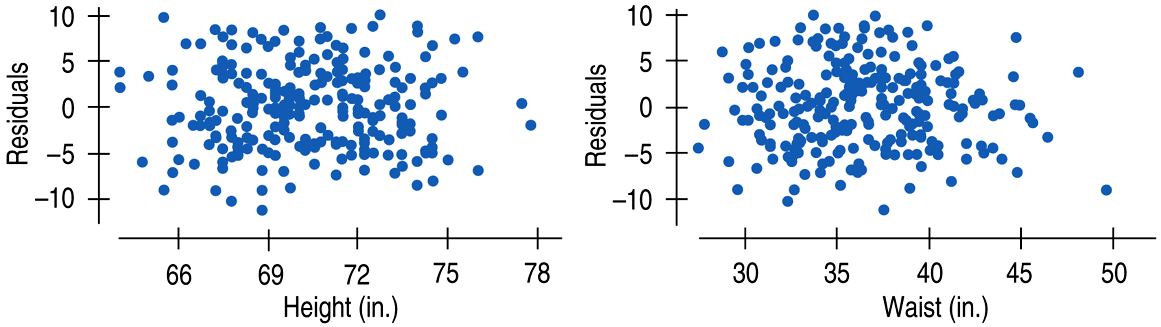
no obvious bend, scatterplot residuals
Independence Assumption:
data presented as representative of male population in U.S.
Does the Plot Thicken?
no obvious changes in the spread
Example: Multiple Regression Step-By-Step
Plan – Think about the assumptions and check the conditions.
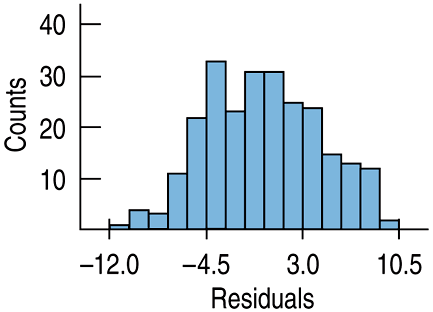
Nearly Normal Condition, Outlier Condition:
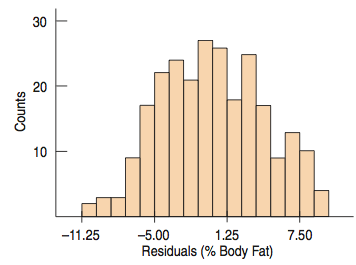
A histogram of the residuals is unimodal and symmetric.
Example: Multiple Regression Step-By-Step
Plan – Think about the assumptions and check the conditions.
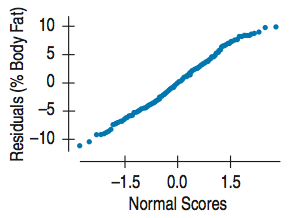
Nearly Normal Condition, Outlier Condition:
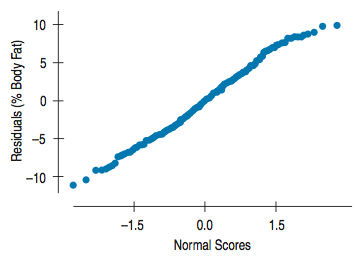
The Normal probability plot of the residuals is reasonably straight:
Under these conditions a full multiple regression analysis is appropriate.
Example: Multiple Regression Step-By-Step
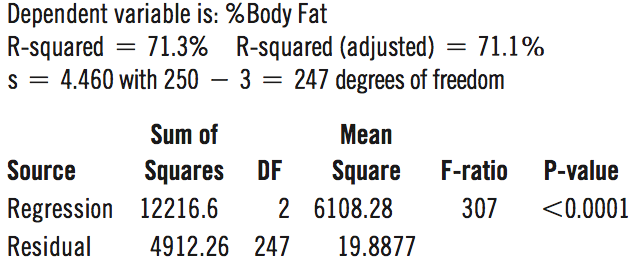
Mechanics – Computer output:
Example: Multiple Regression Step-By-Step
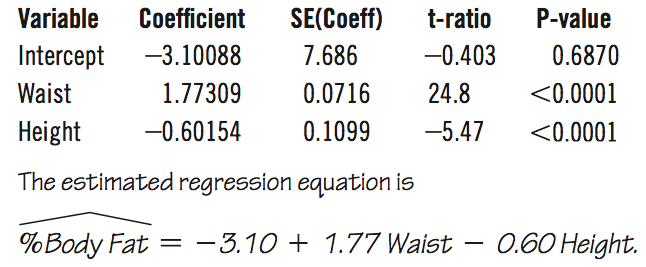
Mechanics
Example: Multiple Regression Step-By-Step
Interpretation
The R2 for the regression is 71.3%.
Waist size and Height together account for about 71% of the variation.
Example: Multiple Regression Step-By-Step
Interpretation
Each inch in Waist size is associated with about a 1.77 increase in %Body Fat among men who are of a particular Height
Each inch of Height is associated with a decrease in %Body Fat of about 0.60 among men with a particular Waist size.
Example: Multiple Regression Step-By-Step
Interpretation
The standard errors for the slopes of 0.07 (Waist) and 0.11 (Height) are both small compared with the slopes themselves
→ looks like the coefficient estimates are fairly precise.
Example: Multiple Regression Step-By-Step
Interpretation
The residuals have a standard deviation of 4.46%, which gives an indication of how precisely we can predict %Body Fat with this model.