Same format as HWs, focus on inference (no CH 15/16)
Problems (can be both tests and CIs) on inference for means, proportions, regression (I will give you the table), one chi-square test, and questions about Analysis of Variance (I will give you the ANOVA table)
Review
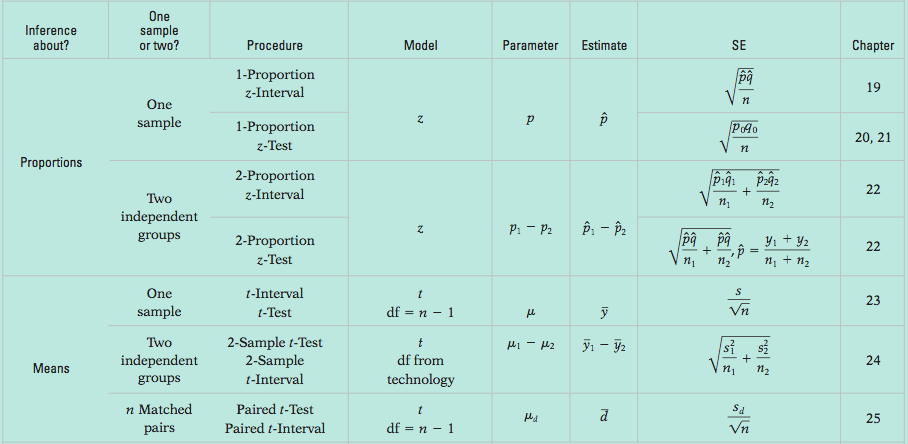
Would being part of a support group that meets regularly help people who are wearing the nicotine patch actually quit smoking? A county health department tries an experiment using several hundred volunteers who were planning to use the patch to help them quit smoking. The subjects were randomly divided into two groups. People in Group 1 were given the patch and attended a weekly discussion meeting with counselors and others trying to quit. People in Group 2 also used the patch but did not participate in the counseling groups. After six months 46 of the 143 smokers in Group 1 and 30 of 151 smokers in Group 2 had successfully stopped smoking. Do these results suggest that such support groups could be an effective way to help people stop smoking?
Inference about?
One sample or two?
Procedure?
Model?
Parameter?
Estimate?
SE?
Would being part of a support group that meets regularly help people who are wearing the nicotine patch actually quit smoking? A county health department tries an experiment using several hundred volunteers who were planning to use the patch to help them quit smoking. The subjects were randomly divided into two groups. People in Group 1 were given the patch and attended a weekly discussion meeting with counselors and others trying to quit. People in Group 2 also used the patch but did not participate in the counseling groups. After six months 46 of the 143 smokers in Group 1 and 30 of 151 smokers in Group 2 had successfully stopped smoking. Do these results suggest that such support groups could be an effective way to help people stop smoking? Now that we’ve concluded the support program is beneficial, can we convince the government to fund it? That might depend on how effective it is.
Inference about?
One sample or two?
Procedure?
Model?
Parameter?
Estimate?
SE?
Chapter 25
Inferences on Regression
25.1
The Population and the Sample
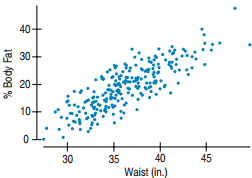
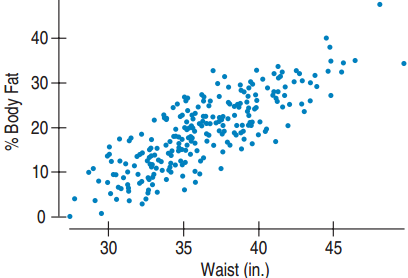
Waist size and %Body Fat
Can we predict the amount of %Body-Fat from Waist size?
We can take a sample of men, measure %Body-Fat and Waist size for each, and run a regression
For each value of Waist size I will have maybe one value, maybe one or two values of %Body-Fat
Waist size and %Body Fat
For each value of Waist size I will have maybe one value, maybe one or two values of %Body-Fat
But what happens if I think about the whole population of men?
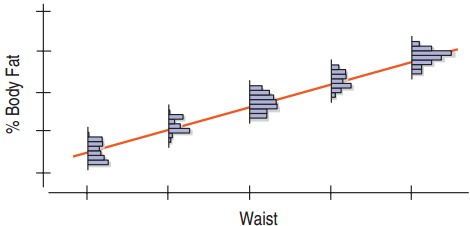
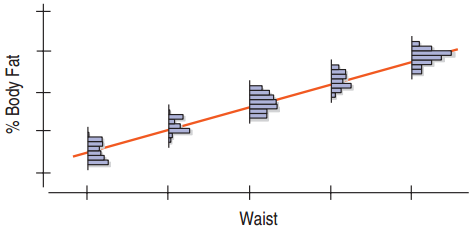
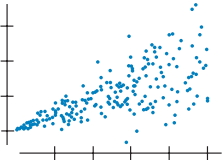
For each value of Waist Size I will have many different values of %Body-Fat!
How will they be distributed?
Waist size and %Body Fat
For each value of Waist Size I will have many different values of %Body-Fat!
How will they be distributed?
For one value of waist size:
And for many values?
Many Distributions for Regression
Many Distributions for Regression
We saw how to build a single sampling distribution for means and proportions.
How do we translate this concept to regression?
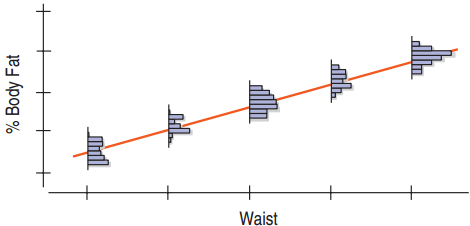
If we think about the population, for each value of waist there are different values of %Body-Fat
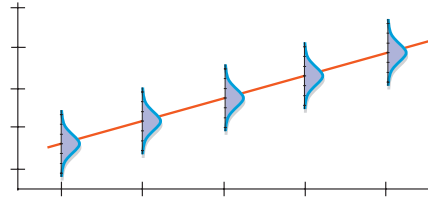
With regression, for each value of x there is a different distribution for y.
This model assumes that for each x, the mean of the y’s is on the regression line.
Many Distributions for Regression
This modelassumes that for each x, the mean of the y’s is on the regression line.
Being a model, it’s an abstraction. It assumes a perfect linear association between the variables. But…
We cannot test the whole population.
Of course, in reality, the linear association is not perfect.
We will use the line from one sample as an estimate.
Sample vs. Model Regression
Sample:\(\ \hat{y} = b_0 + b_1 x\)
This gives a prediction for y based on the sample.
Model:\(\ \mu_y = \beta_0 + \beta_1 x\)
\(\beta_0\) = y-intercept for the model
\(\beta_1\) = slope for the model
The model assumes that for every value of x, the mean of all the y’s lies on the line.
Error
\[\mu_y = \beta_0 + \beta_1 x\]
The model predicts the mean of y for each x, but misses the actual (observed) individual values of y.
The error, \(\varepsilon\), is the amount the line misses the value of y.
\(\varepsilon\) is analogous to e, the residual: \(\ e = y - \hat{y}\)
We want to define a new equation that incorporates the error:
\[y = \beta_0 + \beta_1 x + \varepsilon\]
This new equation gives the exact value of each of the observed y’s.
How Good is the Model?
The least squares regression line \(\ \hat{y} = b_0 + b_1 x\ \) obtained from the sample gives estimates for the model.
\(b_0\) is an estimate for \(\beta_0\).
\(b_1\) is an estimate for \(\beta_1\).
Challenge: How good are these estimates?
1. Linearity Assumption
Straight Enough Condition
Does the scatterplot look relatively straight?
Don’t draw the line. It can fool you.
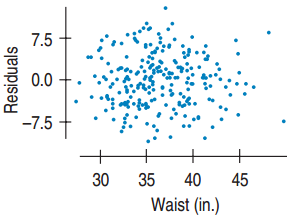
Look at scatterplot of the residuals.
Should have horizontal direction
Should not have a pattern
If straight enough, check the other assumptions.
If not straight, stop or re-express.
2. Independence Assumption
Errors (\(\varepsilon\)’s) must be independent of each other.
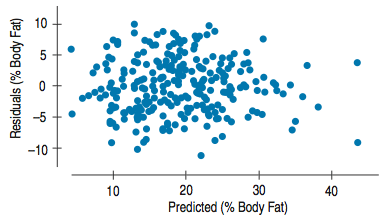
Check residuals plot.
Shouldn’t have clumps, trends, or a pattern.
Should look very random.
For x = time, plot residuals vs. residuals one step later.
Should look very random.
To make inferences about the population, the sample must be representative.
3. Equal Variance Assumption
Variability of y same for all x.
Does the Plot Thicken? Condition: Spread along the line should be nearly constant.
“Fan Shape” is bad →
Standard Deviation of Residuals, \(s_e\), will be used for CI and Hypothesis Tests. This requires same variance for each x.
4. Normal Population Assumption
The errors for each fixed x must follow the Normal model.
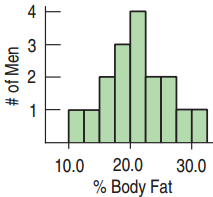
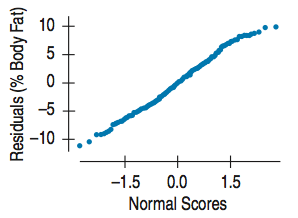
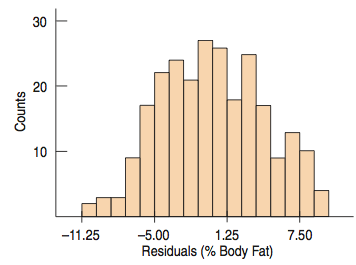
Good enough to use the Nearly Normal Condition – but check for Outliers. Look at the histogram.
With large sample sizes, the Nearly Normal Condition is usually satisfied.
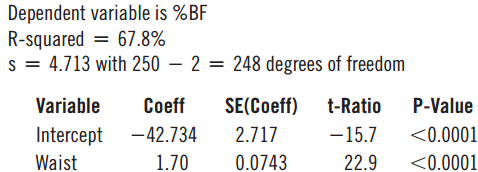
Body Fat and Waist Size
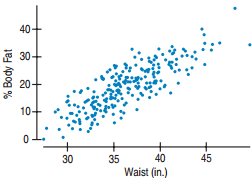
What is the relationship between body fat and waist size in men?
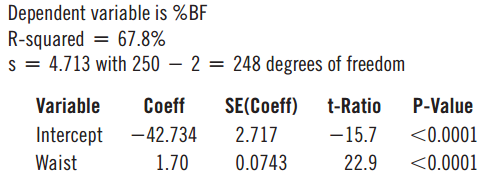
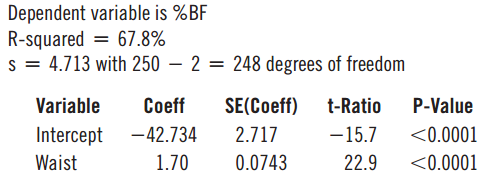
Plan: I have measurements on 250 adult males.
Model:
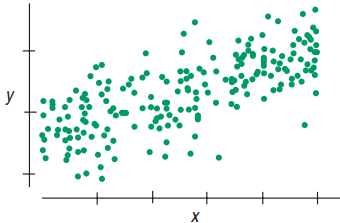
Straight Enough Condition: The scatterplot looks very straight.
Body Fat and Waist Size
Model:
Independence Assumption: No reason to think that one man’s fat influences another’s.
Does the Plot Thicken? Condition: Neither the original scatterplot nor the residuals show changing variances.
There is a 95% chance that this interval captures the true %Body Fat of a randomly selected man with a 38-inch waist.
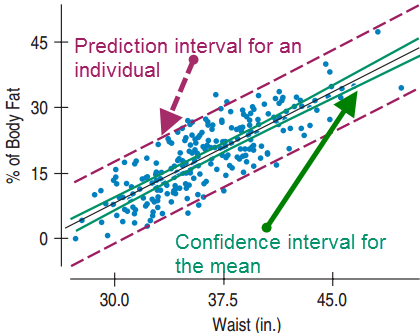
Visualizing the Two Intervals
The prediction interval for the individual is much wider than the confidence interval for the mean.
What Can Go Wrong?
Don’t fit a linear regression to data that aren’t straight.
Stop here or try re-expressing if not straight.
Watch out for the plot thickening.
If the points fan out, then the standard deviations are not constant. Don’t perform regression analysis.
Make sure the errors are Normal.
Check the histogram and normal probability plot. Need Normal to invoke the CLT.
What Can Go Wrong?
Watch out for extrapolation.
The model can fail for x-values that are far from the mean of the x’s.
Watch out for influential points and outliers.
Like other analyses, regression can be strongly influenced by outliers.
Watch out for one-tailed tests.
Software conducts two-tailed tests for regression. If you need one tail, divide the P-value by 2.
Chapter 28
Multiple Regression
28.1
What is Multiple Regression?
Just Do It
The method of least squares can be expanded to include more than one predictor. The method is known as multiple regression.
For simple regression we found the Least Squares solution, the one whose coefficients made the sum of the squared residuals as small as possible.
For multiple regression, we’ll do the same thing, but this time with more coefficients.
Just Do It (cont.)
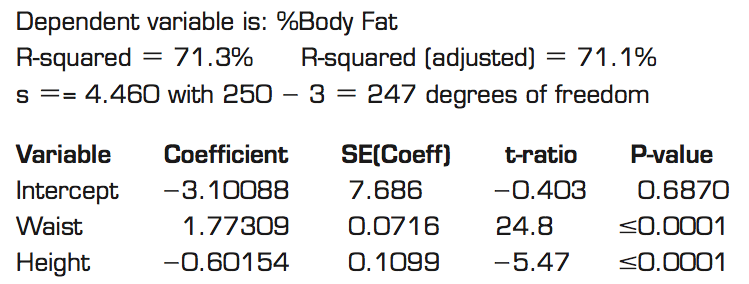
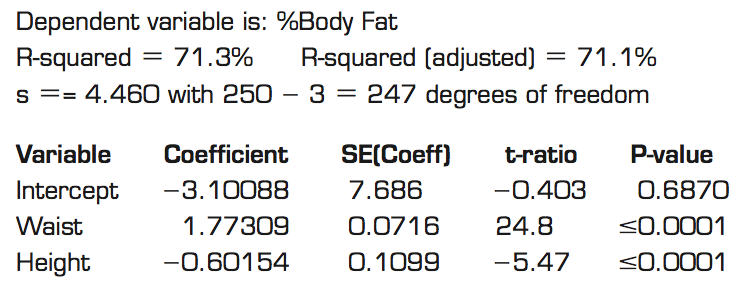
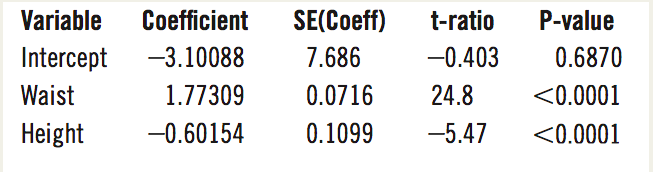
You should recognize most of the numbers in the following example (%body fat) of a multiple regression table. Most of them mean what you expect them to.
So What’s New?
The meaning of the coefficients in the regression model has changed in a subtle but important way.
Multiple regression is an extraordinarily versatile calculation, underlying many widely used Statistics methods.
Multiple regression offers our first glimpse into statistical methods that use more than two quantitative variables.
28.2
Interpreting Multiple Regression Coefficients
What Multiple Regression Coefficients Mean
We said that height might be important in predicting body fat in men.
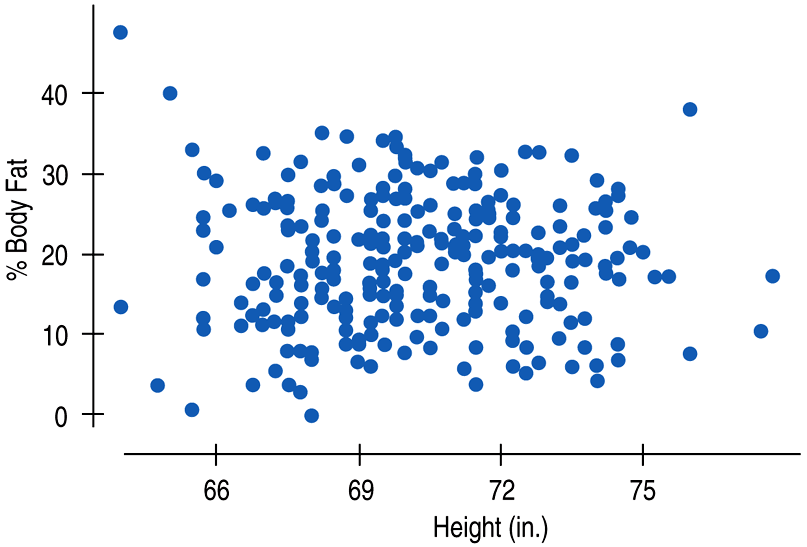
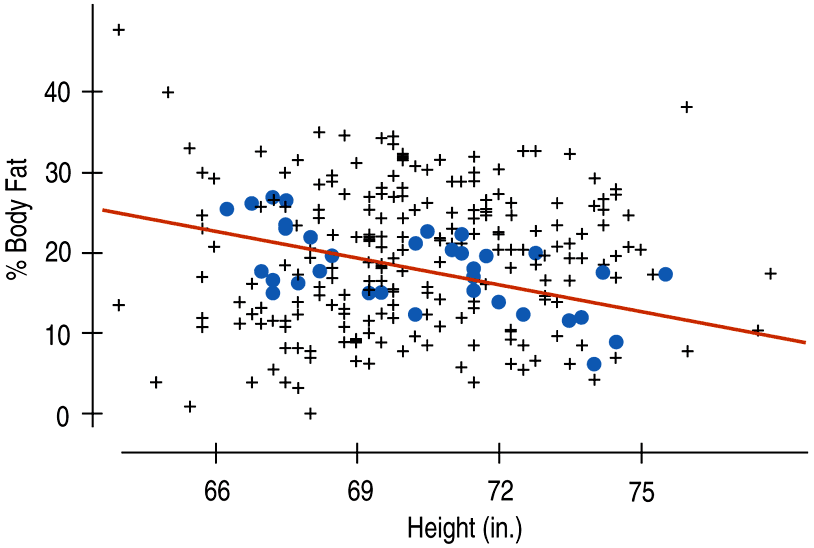
What’s the relationship between %body fat and height in men? Here’s the scatterplot:
What Multiple Regression Coefficients Mean (cont.)
It doesn’t look like height tells us much about %body fat. Or does it?
The coefficient of height in the multiple regression model was statistically significant, so it did contribute to the multiple regression model.
What Multiple Regression Coefficients Mean (cont.)
It doesn’t look like height tells us much about %body fat. Or does it?
The coefficient of height in the multiple regression model was statistically significant, so it did contribute to the multiple regression model.
How can this be?
The multiple regression coefficient of height takes account of the other predictor (waist size) in the regression model.
What Multiple Regression Coefficients Mean (cont.)
For example, when we restrict our attention to men with waist sizes between 36 and 38 inches (points in blue), we can see a relationship between %body fat and height:
What Multiple Regression Coefficients Mean (cont.)
So, overall there’s little relationship between %body fat and height, but when we focus on particular waist sizes there is a relationship.
This relationship is conditional because we’ve restricted our set to only those men with a certain range of waist sizes.
For men with that waist size, an extra inch of height is associated with a decrease of about 0.60% in body fat.
If that relationship is consistent for each waist size, then the multiple regression coefficient will estimate it.
What Multiple Regression Coefficients Mean (cont.)
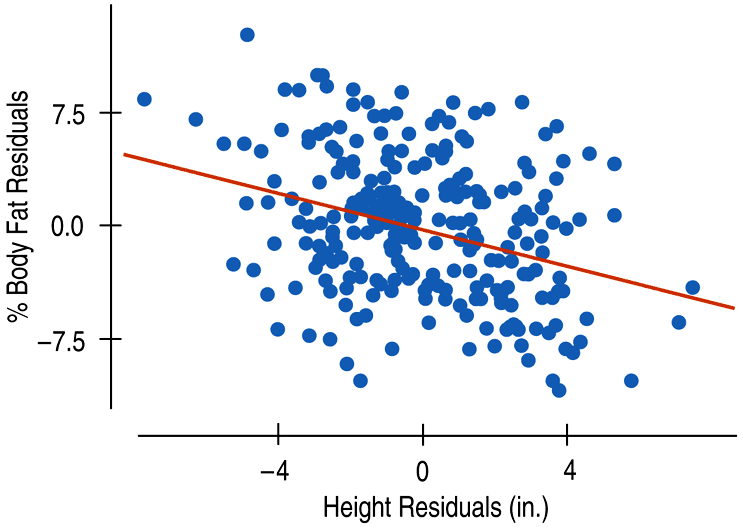
The following partial regression plot based on residuals shows the coefficient of height in the regression model has a slope equal to the coefficient value in the multiple regression model:
28.3
The Multiple Regression Model - Assumptions and Conditions
The Simple Regression Model
\[y = \beta_0 + \beta_1 x + \varepsilon\]
The Multiple Regression Model
For a multiple regression with k predictors, the model is:
The assumptions and conditions for the multiple regression model sound nearly the same as for simple regression, but with more variables in the model, we’ll have to make a few changes.
Assumptions and Conditions
Linearity Assumption:
Straight Enough Condition: Check the partial regression scatterplot for each candidate predictor variable – the shape must not be obviously curved or we can’t consider that predictor in our multiple regression model.
Independence Assumption:
Randomization Condition: The data should arise from a random sample or randomized experiment. Also, check the residuals plot - the residuals should appear to be randomly scattered.
Assumptions and Conditions (cont.)
Equal Variance Assumption:
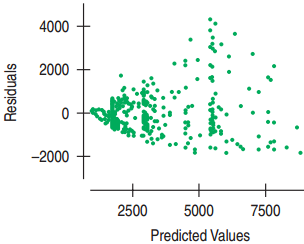
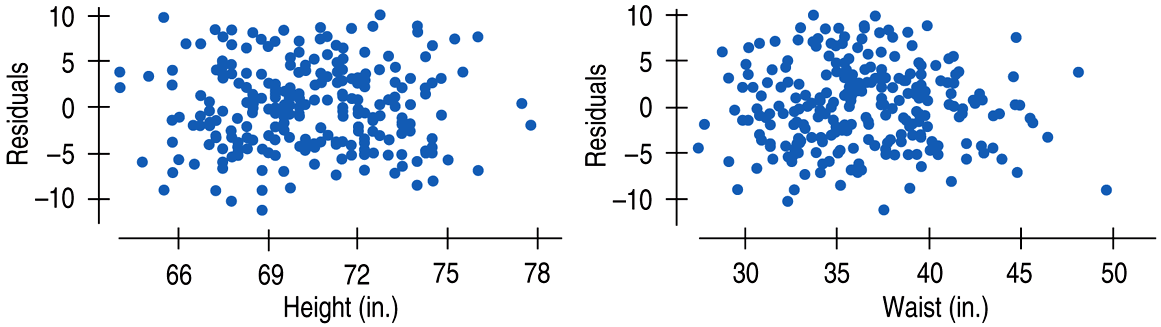
Does the Plot Thicken? Condition: Check the residuals plot – the spread of the residuals should be uniform.
Assumptions and Conditions (cont.)
Normality Assumption:
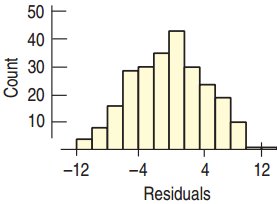
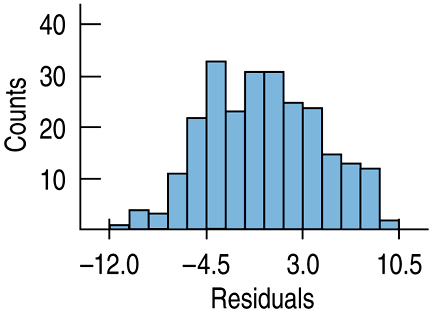
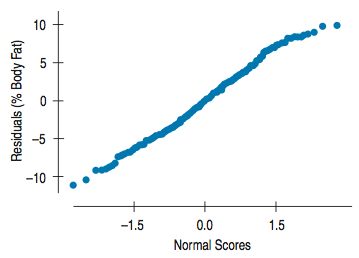
Nearly Normal Condition: Check a histogram of the residuals – the distribution of the residuals should be unimodal and symmetric, and the Normal probability plot should be straight.
Assumptions and Conditions (cont.)
Summary of the checks of conditions in order:
Check the Straight Enough Condition with scatterplots of the y-variable against each x-variable.
If the scatterplots are straight enough, fit a multiple regression model to the data.
Find the residuals and predicted values.
Make and check a scatterplot of the residuals against the predicted values. This plot should look patternless.
Assumptions and Conditions (cont.)
Summary of the checks of conditions in order:
Think about how the data were collected. Randomization? Representative? Plot residuals against time - patterns?
If the conditions check out this far, feel free to interpret the regression model and use it for prediction.
If you wish to test hypotheses about the coefficients or about the overall regression, then make a histogram and Normal probability plot of the residuals to check the Nearly Normal Condition.
Example: Multiple Regression Step-By-Step
How should we model %Body Fat in terms of Height AND Waist size?
Example: Multiple Regression Step-By-Step
Variables – Name the variables, report the W’s, and specify the questions of interest:
Have body measurements on 250 adult males from BYU Human Performance Research Center.
Want to understand relationship between %Body Fat, Height, and Waist size.
Example: Multiple Regression Step-By-Step
Plan – Think about the assumptions and check the conditions.
Straight Enough Condition:
no obvious bend, scatterplot residuals
Independence Assumption:
data presented as representative of male population in U.S.
Does the Plot Thicken?
no obvious changes in the spread
Example: Multiple Regression Step-By-Step
Plan – Think about the assumptions and check the conditions.
Nearly Normal Condition, Outlier Condition:
A histogram of the residuals is unimodal and symmetric.
Example: Multiple Regression Step-By-Step
Plan – Think about the assumptions and check the conditions.
Nearly Normal Condition, Outlier Condition:
The Normal probability plot of the residuals is reasonably straight:
Under these conditions a full multiple regression analysis is appropriate.
Example: Multiple Regression Step-By-Step
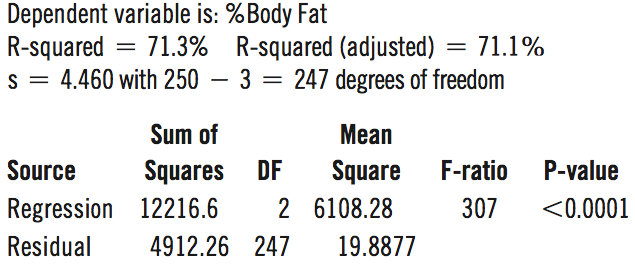
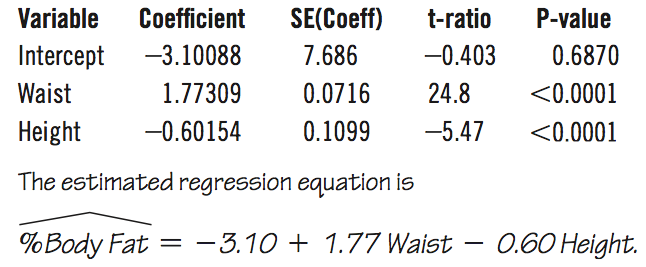
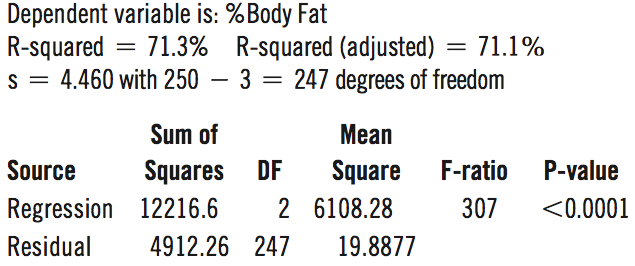
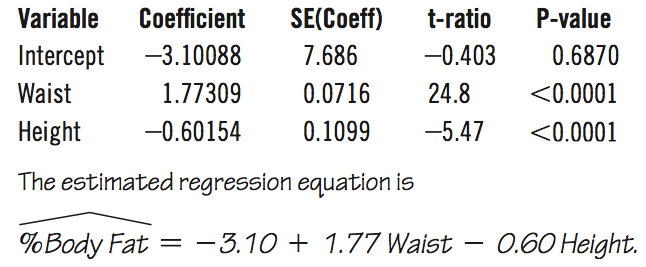
Mechanics – Computer output:
Example: Multiple Regression Step-By-Step
Mechanics – Computer output:
Example: Multiple Regression Step-By-Step
Mechanics
Example: Multiple Regression Step-By-Step
Interpretation
The R2 for the regression is 71.3%.
Waist size and Height together account for about 71% of the variation.
Example: Multiple Regression Step-By-Step
Interpretation
The residuals have a standard deviation of 4.46%, which gives an indication of how precisely we can predict %Body Fat with this model.
Example: Multiple Regression Step-By-Step
Interpretation
The standard errors for the slopes of 0.07 (Waist) and 0.11 (Height) are both small compared with the slopes themselves
→ looks like the coefficient estimates are fairly precise.
Example: Multiple Regression Step-By-Step
Interpretation
Each inch in Waist size is associated with about a 1.77 increase in %Body Fat among men who are of a particular Height
Each inch of Height is associated with a decrease in %Body Fat of about 0.60 among men with a particular Waist size.