Quantitative Methods
Serena DeStefani – Lecture 18 – 8/6/2020
Announcements
HW8 due today
HW9 due Monday
Today: Analysis of Variance (ANOVA)
After ANOVA → general review (Mon and Tue)
Next Wednesday: Final exam
Announcements: Final Exam
- Non-cumulative, covers CH 17-28 (no CH 15/16)
- for CH 26, 27, 28, focus on material covered in slides
- Same format as HWs, focus on inference
Announcements: Final Exam
- Inference problems (can be either hypothesis tests or confidence intervals) on:
- Proportions (one-sample / two-samples)
- Means (one-sample / two-samples / paired data)
- Regression
- one chi-square test
- questions about Analysis of Variance
- (I will give you the ANOVA table)
- A few conceptual questions incorporated into the problems
- Total of 40/45 questions
Review
![]()
Would being part of a support group that meets regularly help people who are wearing the nicotine patch actually quit smoking? A county health department tries an experiment using several hundred volunteers who were planning to use the patch to help them quit smoking. The subjects were randomly divided into two groups. People in Group 1 were given the patch and attended a weekly discussion meeting with counselors and others trying to quit. People in Group 2 also used the patch but did not participate in the counseling groups. After six months 46 of the 143 smokers in Group 1 and 30 of 151 smokers in Group 2 had successfully stopped smoking. Do these results suggest that such support groups could be an effective way to help people stop smoking?
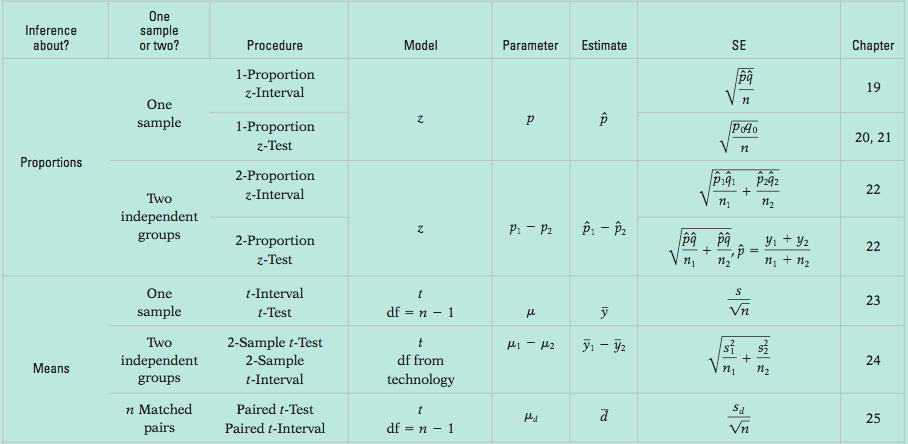
- Inference about?
- One sample or two?
- Procedure?
- Model?
- Parameter?
- Estimate?
- SE?
Would being part of a support group that meets regularly help people who are wearing the nicotine patch actually quit smoking? A county health department tries an experiment using several hundred volunteers who were planning to use the patch to help them quit smoking. The subjects were randomly divided into two groups. People in Group 1 were given the patch and attended a weekly discussion meeting with counselors and others trying to quit. People in Group 2 also used the patch but did not participate in the counseling groups. After six months 46 of the 143 smokers in Group 1 and 30 of 151 smokers in Group 2 had successfully stopped smoking. Do these results suggest that such support groups could be an effective way to help people stop smoking? Now that we’ve concluded the support program is beneficial, can we convince the government to fund it? That might depend on how effective it is.
- Inference about?
- One sample or two?
- Procedure?
- Model?
- Parameter?
- Estimate?
- SE?
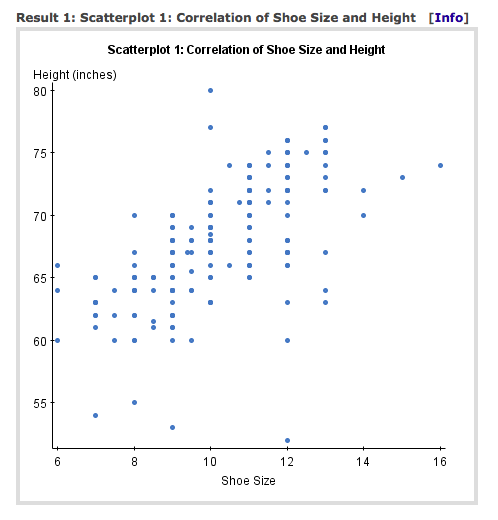
Shoe size and height: a small sample
![]()
Shoe size and height
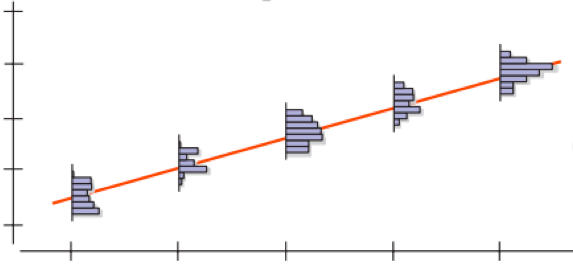
A bigger sample: many y values for each x
![]()
Sample vs. Model Regression
Sample: \(\hat{y} = b_0 + b_1 x\)
- This gives a prediction for y based on the sample.
Model: \(\mu_y = \beta_0 + \beta_1 x\)
- \(\beta_0\) = y-intercept for the model
- \(\beta_1\) = slope for the model
- The model assumes that for every value of x, the mean of all the y’s lies on the line.
\[y = \beta_0 + \beta_1 x + \varepsilon\]
How Good is the Model?
Use sample values as estimates
- The least squares regression line \(\hat{y} = b_0 + b_1 x\) obtained from the sample gives estimates for the model.
- \(b_0\) is an estimate for \(\beta_0\).
- \(b_1\) is an estimate for \(\beta_1\).
- Challenge: How good are these estimates?
Sampling Distribution for Regression Slopes
When the conditions are met, \(t = \dfrac{b_1 - \beta_1}{SE(b_1)}\) follows Student’s t-model with df = n – 2.
Estimate of the standard error:
\[SE(b_1) = \frac{s_e}{\sqrt{n-1}\, s_x}, \quad s_e = \sqrt{\frac{\sum (y - \hat{y})^2}{n-2}}\]
Testing for \(\beta_1\)
If no linear association, \(\beta_1 = 0\)
H0: \(\beta_1 = 0\)
\(t_{n-2} = \dfrac{b_1 - 0}{SE(b_1)}\)
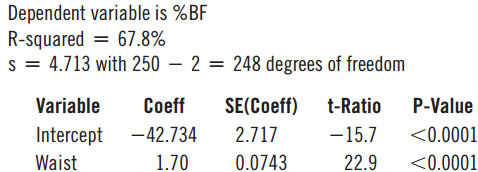
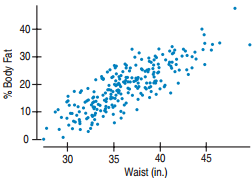
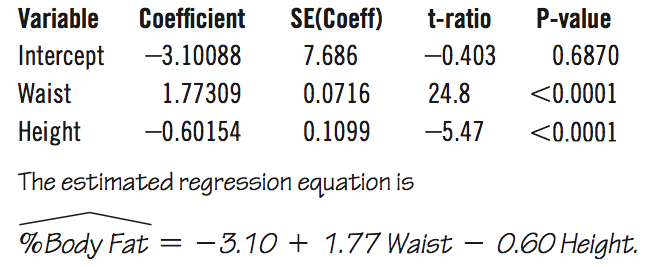
For the %Body Fat and Waist data:
\[\frac{1.7 - 0}{0.0743} \approx 22.9 \qquad \text{P-value} < 0.0001\]
- Very unlikely to have such a high \(b_1\) if \(\beta_1 = 0\)
- IF no association in population, sample is unlikely
Confidence Interval for \(\beta_1\)
- The hypothesis test for %Body Fat and Weight told us what we already know.
- A confidence interval is needed.
\[b_1 \pm t^*_{n-2} \times SE(b_1)\]
For %Body Fat and Weight:
1.7 ± 1.97 × 0.074 = (1.55%, 1.85%)
With 95% confidence the slope of the line for %Body Fat and Weight is between 1.55% and 1.85%.
Chapter 26
Analysis of Variance
Hand Washing Comparison
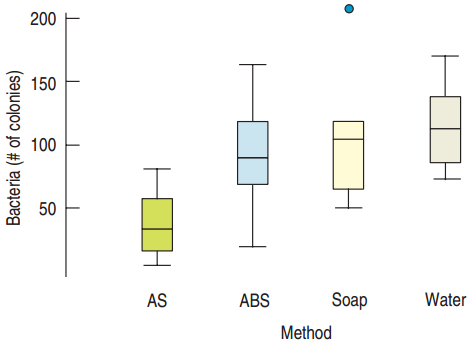
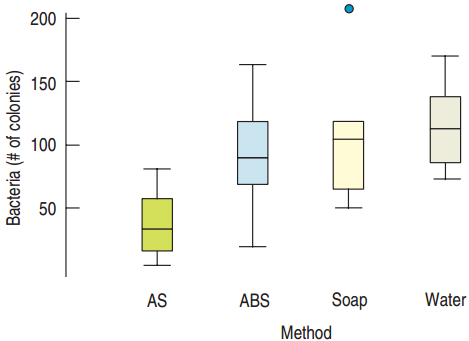
Is there a difference between washing hands with: water only, regular soap, antibacterial soap (ABS), and antibacterial spray (AS)?
- Each tested with 8 replications
- Treatments randomly assigned
![]()
Hand Washing
- Null hypothesis: All the means are the same.
- Alternative hypothesis: The means are not all the same.
26.1
Testing Whether the Means of Several Groups Are Equal
Comparing Many Means
H0: All means are the same (= from same underlying population)
HA: Not all the means are the same.
If all the same, then they should not vary too much. Maybe a little bit, because the samples are different (→ “sampling variability”)
Considering the means as data values, we measure the variance of this data.
If the means of the underlying population are different, the variance will be larger.
Variation within and between
![]()
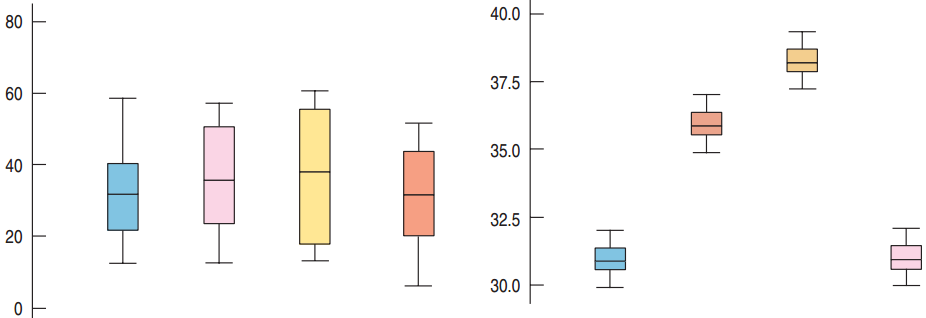
- The means in the two examples are the same!
- The variances are different
Comparing Means
![]()
- The means in the two examples are the same!
- The variances are different
- Second case: the variation within is so small that the differences between stand out
Comparing Means
![]()
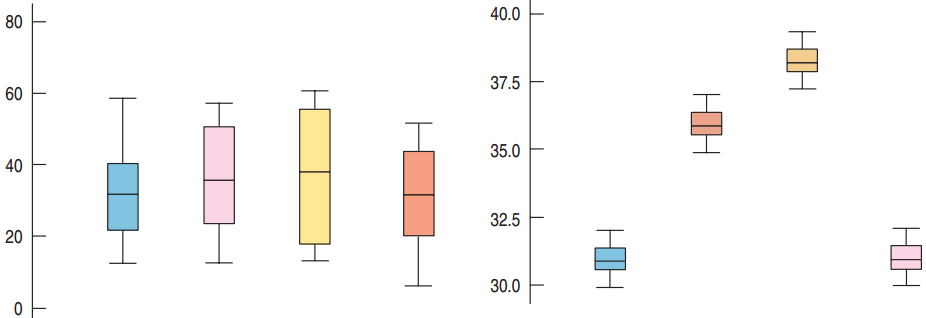
- Note scales.
- Left: Plausible that the means are equal. Large variance within each sample, not between samples.
- Right: Means not equal. Small variance within samples, large variance between
Comparing Many Means: the F-test
- Second case: the variation within is so small that the differences between stand out
- This is the idea behind the F-test: we compare the variation within the groups with the variation between the groups
- If Var Between > Var Within → we reject the null
- If Var Between < Var Within → we fail to reject the null
Comparing Many Means:
the variance BETWEEN
- To compare two means: t-test on the difference.
- To compare many means?
- If H0 is true, there is a common mean.
- Look at the differences from this common mean.
- How do we do that?
- The variance of all the means does just that.
- This variance of the sample means is a measure of how much the sample means differ from each other.
- If H0 is true, this variance should be small.
Washing Type All the Same?
H0: \(\mu_1 = \mu_2 = \mu_3 = \mu_4\)
We will calculate the variance between the means
It is an estimate of \(\sigma^2\), the variance of the observations.
Washing Type All the Same?
H0: \(\mu_1 = \mu_2 = \mu_3 = \mu_4\)
We will calculate the variance between the means
It is an estimate of \(\sigma^2\), the variance of the observations.
1) First, by CLT: \(Var(\bar{y}) = \dfrac{\sigma^2}{n} = \dfrac{\sigma^2}{8}\)
This is the variance of the sampling distribution of the means
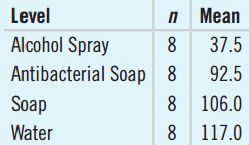
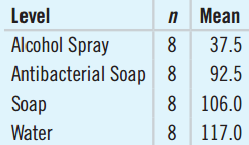
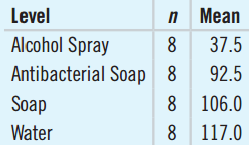
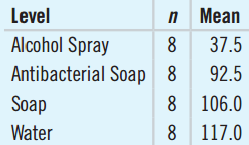
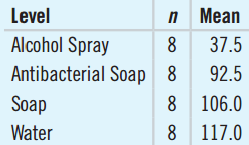
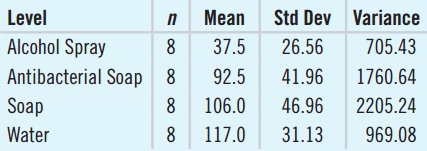
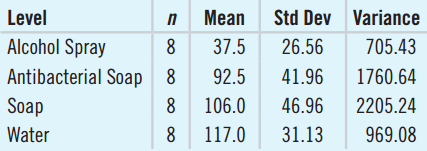
Variance of {37.5, 92.5, 106.0, 117.0} is 1245.08.
Washing Type All the Same?
H0: \(\mu_1 = \mu_2 = \mu_3 = \mu_4\)
We will calculate the variance between the means
It is an estimate of \(\sigma^2\), the variance of the observations.
1) First, by CLT: \(Var(\bar{y}) = \dfrac{\sigma^2}{n} = \dfrac{\sigma^2}{8}\) (variance of the SAMPLING DISTRIBUTION OF THE MEANS)
Variance of {37.5, 92.5, 106.0, 117.0} is 1245.08.
- 2) \(\dfrac{\sigma^2}{8} = 1245.08 \rightarrow \sigma^2 = 9960.64\) (I estimate the variance of OBSERVATIONS)
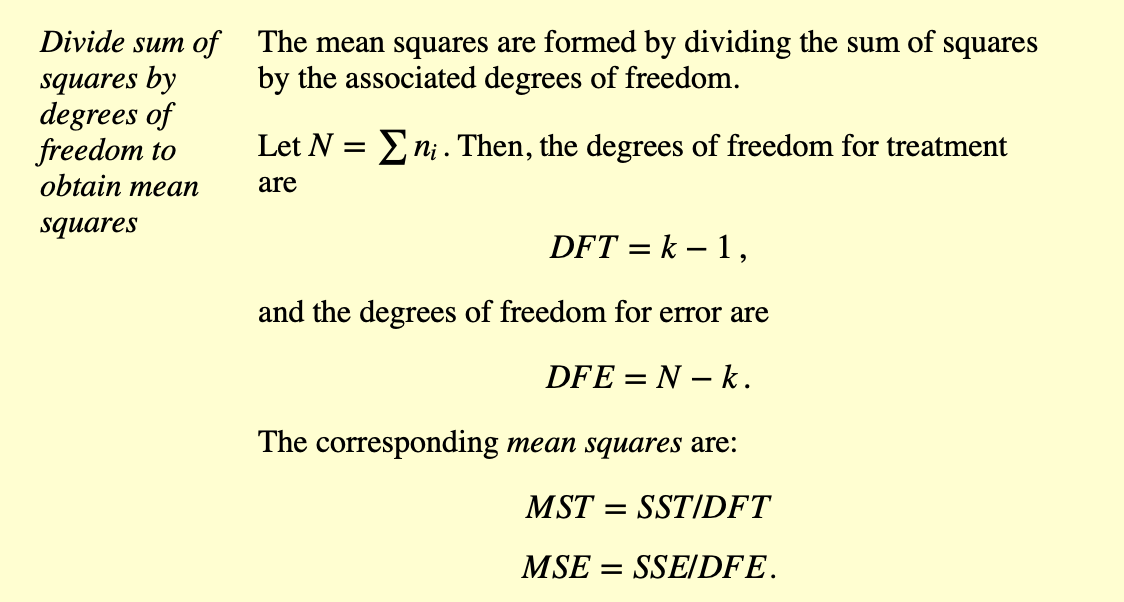
This estimate for \(\sigma^2\) is called the Treatment Mean Square or \(MS_T\),
Also: Between Mean Square, Regression Mean Square
Washing Type All the Same?
- H0: \(\mu_1 = \mu_2 = \mu_3 = \mu_4\)
\[\frac{\sigma^2}{8} = 1245.08 \rightarrow \sigma^2 = 9960.64\]
(Estimates variance of OBSERVATIONS)
This estimate for \(\sigma^2\) is called \(MS_T\).
\(MS_T\) depends on whether the means are equal or not
If the null were true, and the means were basically equal (belonging to the same distribution), then this variance is due only to sampling, only to the observations, so that \(MS_T\) perfectly estimates \(\sigma^2\)
Washing Type All the Same?
- H0: \(\mu_1 = \mu_2 = \mu_3 = \mu_4\)
\[\frac{\sigma^2}{8} = 1245.08 \rightarrow \sigma^2 = 9960.64\]
(Variance of OBSERVATIONS)
This estimate for \(\sigma^2\) is called \(MS_T\)
- Depends on whether the means are equal or not
- Means are closer → \(MS_T\) gets smaller
- Means are farther apart → \(MS_T\) gets bigger → reject null
- Is this very high compared to what we would expect?
- To know, we need to compare it to another value.
The Variance WITHIN
![]()
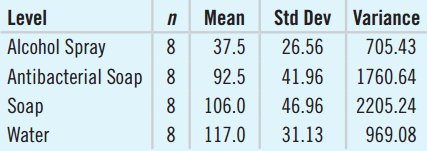
- There is another way to estimate the variance of observations \(\sigma^2\): the variance within
- Assume each washing method has the same sample variance.
- Then we can pool them all together to get the pooled variance \(s_p^2\).
- Does not depend on whether means are equal or not
- Since the sample sizes are all equal, we can average the four variances: \(s_p^2 = 1410.10\).
- Other names for \(s_p^2\): Error Mean Square or \(MS_E\)
- Within Mean Square. It estimates \(\sigma^2\) directly.
Comparing \(MS_T\) and \(MS_E\)
\(MS_T\) (between)
- Estimates \(\sigma^2\) if H0 is true and the means are equal
- Should be larger than \(\sigma^2\) if H0 is false
\(MS_E\) (within)
- Estimates \(\sigma^2\) whether H0 is true or not
- If H0 is true, both close to \(\sigma^2\), so \(MS_T\) is close to \(MS_E\)
Comparing
- If H0 is true, \(MS_T / MS_E\) should be close to 1
- If H0 is false, \(MS_T / MS_E\) tends to be > 1
- But how do we tell whether \(MS_T / MS_E\) is large enough?
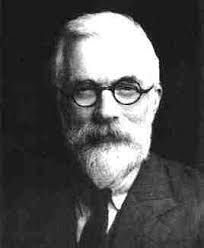
Sir Ronald Fisher Saves the Day!
How do we tell whether \(MS_T / MS_E\) is large enough to not be due just to random chance?
\(MS_T / MS_E\) follows the F-Distribution
- Numerator df: k – 1 (k = number of groups)
- Denominator df: k(n – 1)
- n = # observations in each group
\(F = MS_T / MS_E\) is called the F-Statistic.
Analysis of Variance
![]()
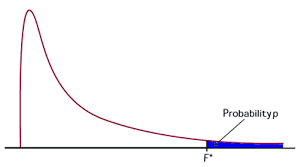
- The area to the right of the F-statistic represents the P-Value → probability I can get a more extreme value of F
- If the P-value is small, we reject H0 and conclude that there is evidence that the means are not all equal to each other.
- Since both \(MS_T\) and \(MS_E\) come from looking at variances, we did an ANalysis Of VAriance.
- ANOVA
Back to Bacteria
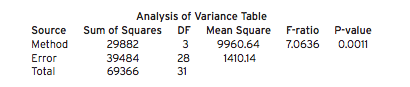
\(MS_T\) = 9960.64, \(MS_E\) = 1410.14
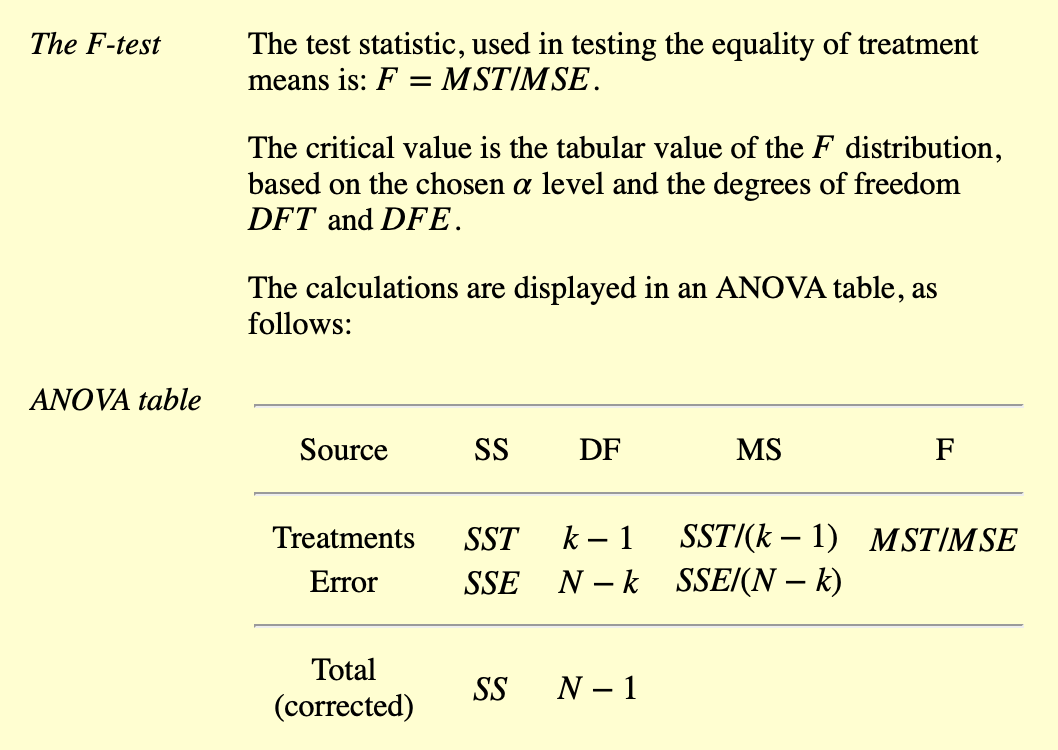
\(F = \dfrac{MS_T}{MS_E} = \dfrac{9960.64}{1410.14} \approx 7.06\)
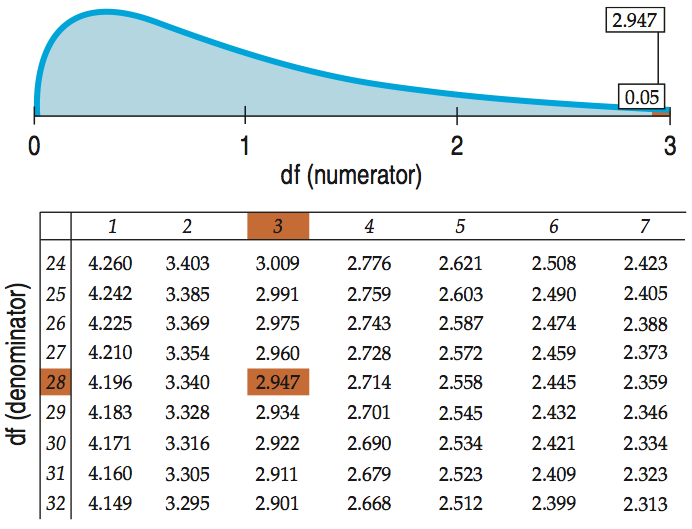
Num: df = 4 – 1 = 3, Den: df = 4(8 – 1) = 28.
Technology gives P-value for \(F_{3,28}\) = 0.0011.
The F-Table
![]()
Conclusions About Hand Washing
If the means were all equal then only 11 in 10,000 experiments such as these would have \(MS_T / MS_E\) at least as large as 7.06.
We have strong evidence that the four different methods of hand washing are not equally effective at eliminating germs.
Residual Standard Deviation
- To have the response variable’s units, we should work with the standard deviation instead of the variance:
\[s_p = \sqrt{MS_E} = \sqrt{\frac{\sum e^2}{N-k}}\]
\(s_p\) is the residual standard deviation.
For the hand washing data: \(s_p = \sqrt{1410.14} \approx 37.6\)
This is a reasonable compromise standard deviation for all four groups.
Contrast Baths
Contrast baths: To reduce hand swelling and stiffness in patients that had carpal tunnel release surgery, hands are alternately immersed in cold and hot water.
- 59 patients randomly assigned to one of:
- Contrast bath with no exercise
- Contrast bath with exercise
- Exercise but no contrast bath
- Specify the subjects, sample size, experimental factor, treatment levels, response, null hypothesis, and research methods.
Contrast Baths
- Subjects: Patients receiving carpal tunnel release surgery
- Sample Size: 59
- Factor: Contrast bath treatment
- Levels: Contrast bath alone, Contrast with exercise, Exercise only.
- Response: Change in hand volume
- Null Hypothesis: Mean change in hand volume same for all three treatments
- Methods: Single blind (patients but not the researchers aware of treatments)
Bath Treatment
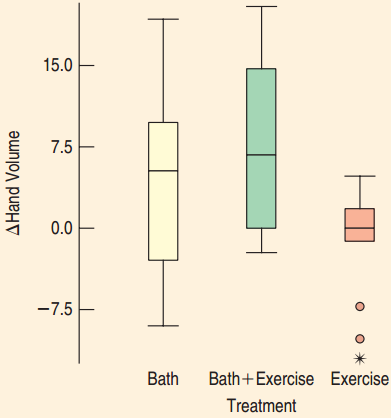
What does the boxplot tell us about the means for the three treatments?
Not much difference between the two contrast bath treatments.
The exercise only treatment may result in less swelling.
Hand Washing
![]()
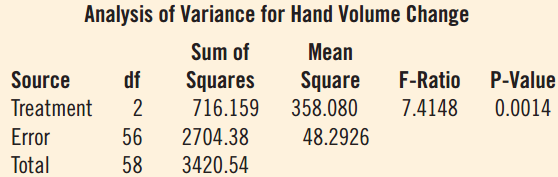
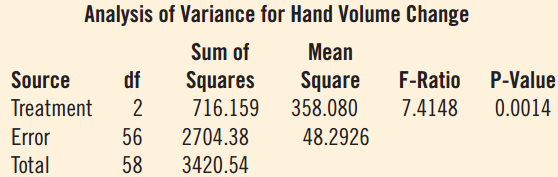
- What does the ANOVA table say about the differences in the mean swelling for the three different types of contrast bath treatments?
- F = 7.4148 and the P-value is small.
- We can reject the null hypothesis that the mean change in hand volume is the same for all three treatments.
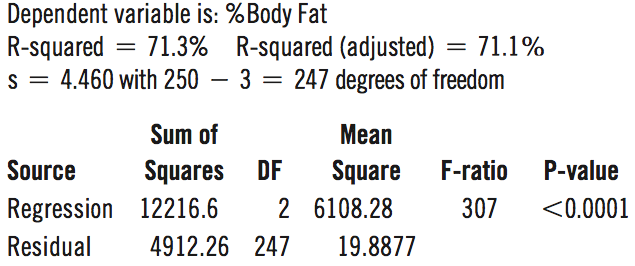
Review - Multiple Regression:
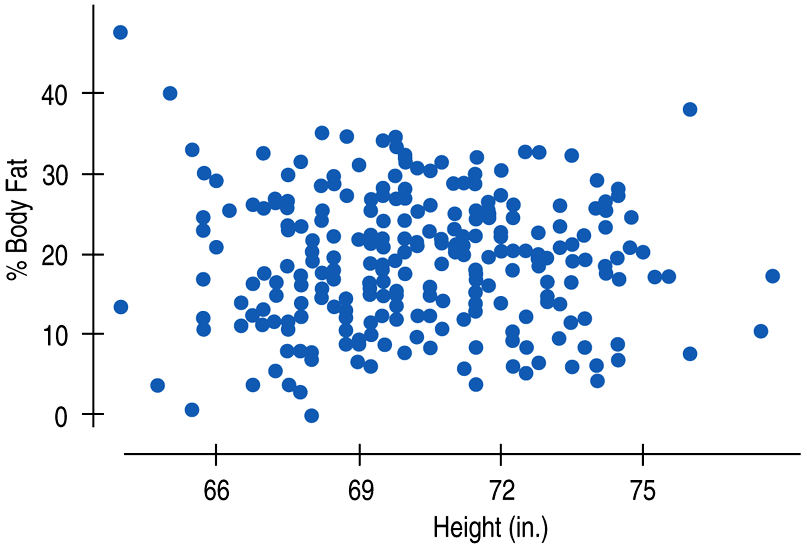
Waist, Height and %BodyFat
Computer output:
Example: Multiple Regression
![]()
Assumptions and Conditions
- To check the assumptions and conditions for ANOVA, always look at the side-by-side boxplots.
- Check for outliers within any group.
- Check for similar spreads.
- Look for skewness.
- Consider re-expressing.
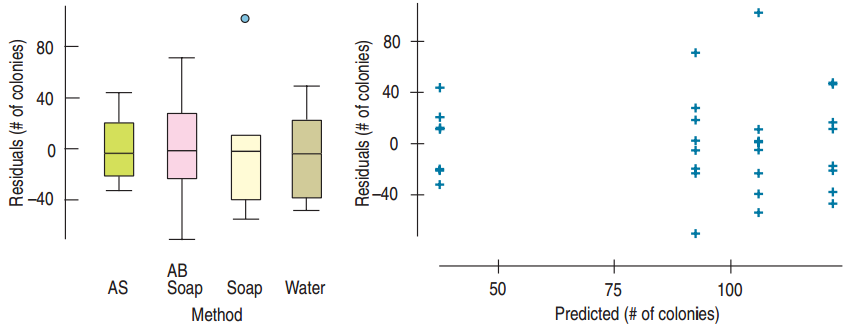
Checking Conditions for Hand Washing
![]()
- IQR’s are about the same for all groups.
- “The Plot Does Not Thicken.”
- One outlier, not too extreme
- \(s_p\) = 37.6 reasonable for all four groups
Normal Population Assumption
Nearly Normal Condition
- Must be satisfied for each group.
- Use side-by-side boxplot to check for skewness and outliers.
- Equal Variance Condition allows us to look at all the residuals together.
- Use a histogram and Normal probability plot of all the data to check for Normality.
One Way ANOVA F-Test
H0: \(\mu_1 = \mu_2 = \cdots = \mu_k\)
\(F = \dfrac{MS_T}{MS_E}\)
\(MS_T\) is found FROM the variance BETWEEN means of the treatment groups.
\(MS_E\) is found by POOLING the variances WITHIN each of the treatment groups.
If F is large, reject H0.
What Next?
ANOVA:
- P-value large → Nothing left to say
- P-value small → Which means are large and which means are small?
- We can perform a t-test to compare two of them.
- We assumed the standard deviations are all equal.
- Use \(s_p\), for pooled standard deviations.
- Use the Student’s t-model, df = N – k (N = total number of trials)
t-Test for Hand Washing
H0: \(\mu_W - \mu_{ABS} = 0\)
HA: \(\mu_W - \mu_{ABS} \neq 0\)
Diff. in observed means: 117.0 – 92.5 = 24.5.
\[SE(\mu_W - \mu_{ABS}) = s_p\sqrt{\frac{1}{n_W} + \frac{1}{n_{ABS}}} \approx 18.775\]
\[t = \frac{24.5}{18.775} \approx 1.31, \quad df = 32 - 4 = 28, \quad \text{P-value} = 0.2\]
- We cannot discern a difference between washing with antibacterial soap and just using water.
Bonferroni Multiple Comparisons
- If we wanted to do a t-test for each pair:
- P(Type I Error) = 0.05 for each test.
- Good chance at least one will have a Type I error.
- Bonferroni devised a correction:
- Adjust \(\alpha\) to \(\alpha/J\) where J is the number of comparisons.
- 95% confidence (1 – 0.05) with 3 comparisons adjusts to (1 – 0.05/3) ≈ 0.98333.
- Use this adjusted value to find t**.
26.5
ANOVA on Observational Studies
The Trouble with Observational Studies
- Difficult to verify equal variances.
- May not have the same sample size for each treatment.
- Without randomization, causation cannot be concluded even with a small P-value.
- Cannot avoid lurking variables.
- Since the subjects are not randomly assigned, the confidence interval may not represent the general population.
Who Watches More TV?
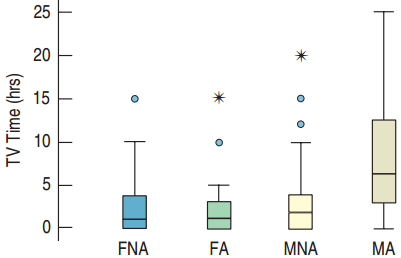
Four groups: male athletes (MA), male non-athletes (MNA), female athletes (FA), and female non-athletes (FNA) were surveyed. Do these four groups spend about the same amount of time watching TV?
Variables: Number of hours watching TV, the viewer’s gender and athlete status. Total of 197 randomly selected respondents.
Who Watches More TV?
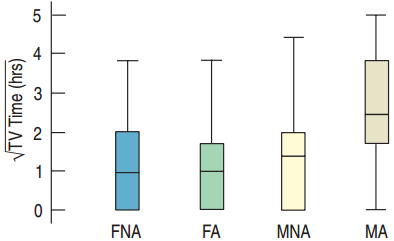
- Plot: Trouble! Each skewed, outliers (some extreme), category with highest center has a large spread.
- Re-express with a root.
- Randomization Condition: Students selected randomly.
- Similar Spread Condition: New boxplot much better.
Who Watches More TV?
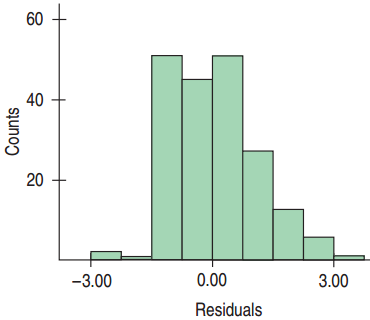
- Nearly Normal Condition: Histogram of the residuals looks reasonably normal.
- It is appropriate to use ANOVA.
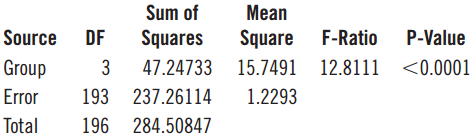
- Conclusion: The F-statistic is large and the corresponding P-value small. I conclude that the TV-watching behavior is not the same among these groups.
So Do Male Athletes Watch More TV?
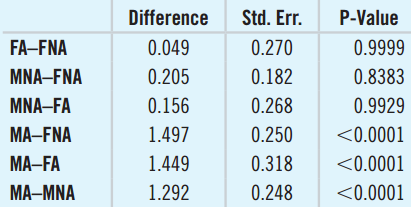
- Bonferroni comparison of all pairs of groups.
- Three significant differences:
- Male athletes watch more TV than both female athletes and non-athletes.
- Male athletes watch more than male non-athletes.
- Does this generalize to all weeks and all colleges?
- The study was conducted during the NCAA men’s basketball tournament.
What Can Go Wrong?
Watch out for outliers.
- Outliers affect most ANOVA statistics: mean, spread, F, P-value.
- Increase P(Type II Error).
Watch out for changing variances.
- ANOVA depends on independence, constant variance, and Normality.
- If conditions on the residuals are violated, try re-expressing.
What Can Go Wrong?
Be wary of drawing conclusions about causality from observational studies.
- Causality can only be concluded by ANOVA from randomized experiments.
Be wary of generalizing.
- Don’t generalize if the data do not represent the general population.
Watch for multiple comparisons.
- Use a multiple comparison method such as Bonferroni to test many pairs.
Chapter 27
Multifactor Analysis of Variance
27.1
A Two-Factor ANOVA Model
Two Factors at Once?!
Unlike experiments we have seen thus far, some studies have not one but two factors.
Example: study on accuracy throwing darts
Depends on which hand used and distance
Two Factors at Once?!
Two factors do not confuse things, but rather improve the experiment and analysis.
With two factors we have two hypotheses tests.
Each of those hypotheses asks whether the mean of the response variable is the same for each of the treatment levels.
Earlier, we considered ways to remove or avoid extra variation in designing experiments. A two-factor experiment does just that.
An ANOVA Model (cont)
Our null hypothesis on each factor is that the effects of that treatment are all zero (the means are equal)
The alternative hypotheses are that the treatment effects are not all equal (the means are different)
We want to compare the differences BETWEEN the treatment effects with the underlying variability WITHIN the treatment.
27.2
Assumptions and Conditions
Partial boxplots
Plot the Data …
Start by using side-by-side boxplots across levels of each factor.
Look for outliers and correct them or omit them if you can’t correct them.
The problem with looking at the boxplots is that the responses at each level of the factor contain all levels of the other factor.
Partial boxplots
Plot the Data …
A better alternative would be to make boxplots for each factor level after removing the effects of the other factor.
We could compute a one-way ANOVA on one factor and find the residuals. Then, make boxplots of those residuals for each level of the other factor. We might call this display a partial boxplot.
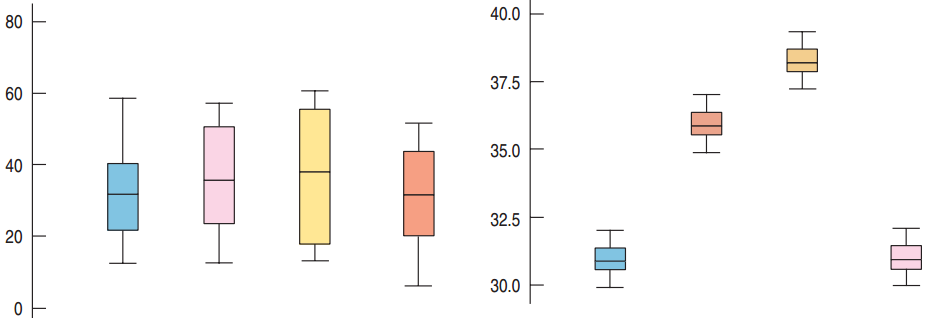
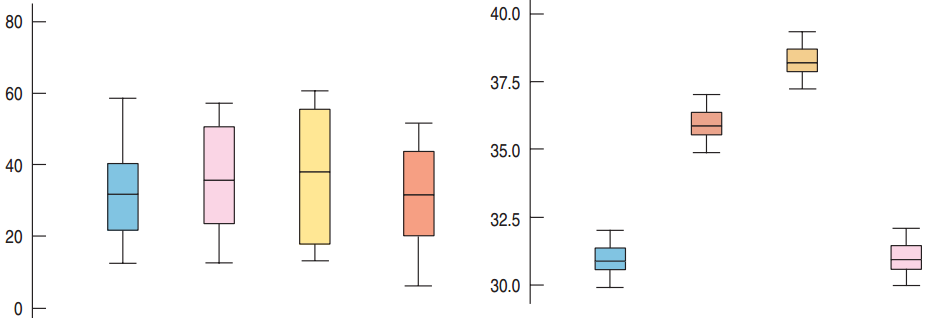
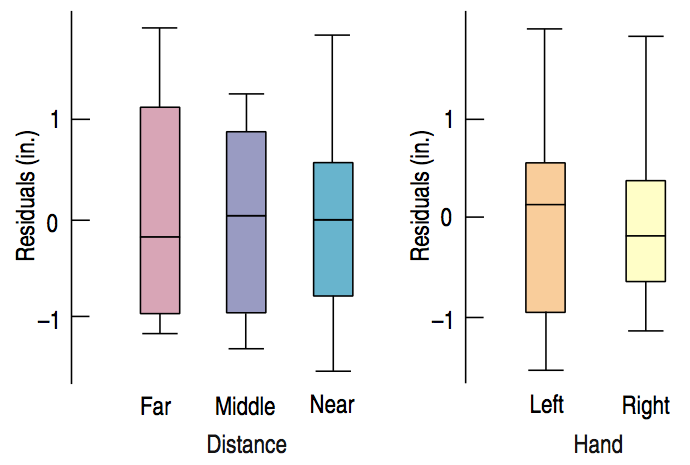
Dart-throwing study: partial boxplots
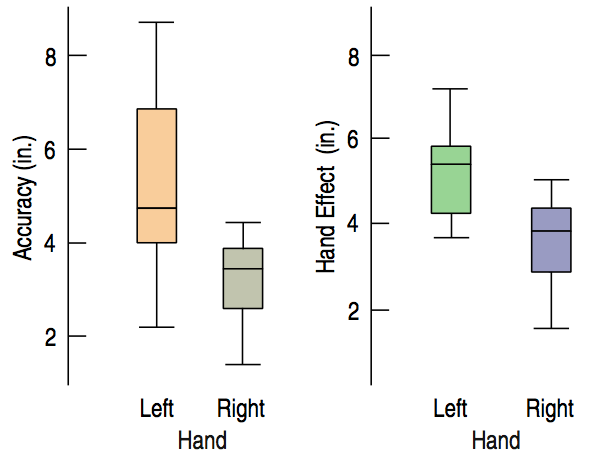
- Boxplots of Accuracy by Hand (1) show the effect of changing Hand less clearly
- Boxplots on the right (2) show the effects of Hand after the effect of Distance has been removed.
- The effect of changing hands is much easier to see.
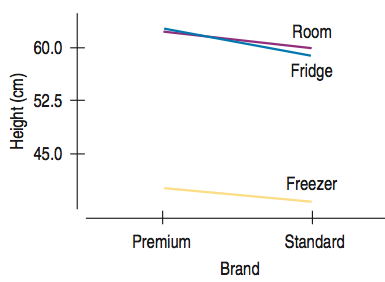
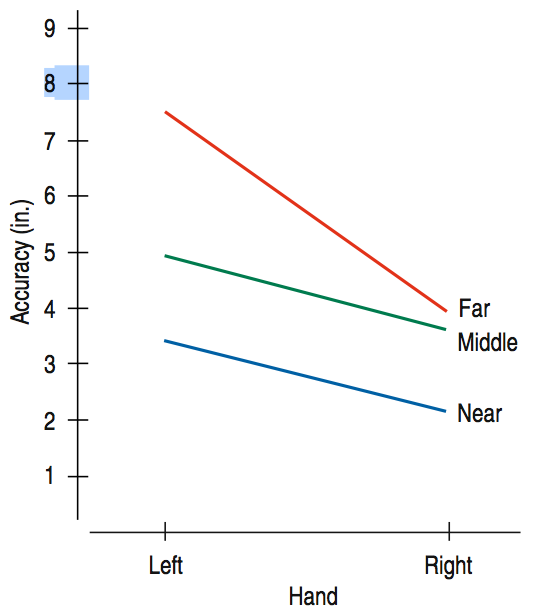
Interaction Plot
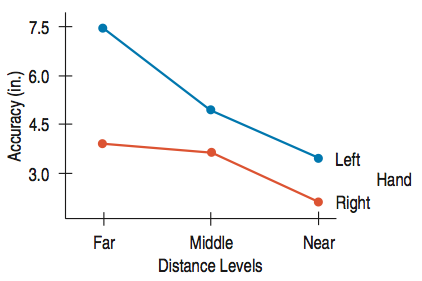
When the effects of one factor change for different levels of another factor, we say there is an interaction. To show the interaction, we use an interaction plot.
![]()
This plot shows the averages of the observations at each level of one factor broken up by the levels of the other factors.
Assumptions and Conditions
Independence Assumptions
- An Independence Assumption for the two-factor model is the same as in a one-way ANOVA. Hence, the observations within each treatment group must be independent of each other. However, no test can verify that assumption.
- Check the Randomization Condition. Were the data collected with suitable randomization? This is true for both surveys and experiments.
Assumptions and Conditions (cont)
Equal Variance Assumption
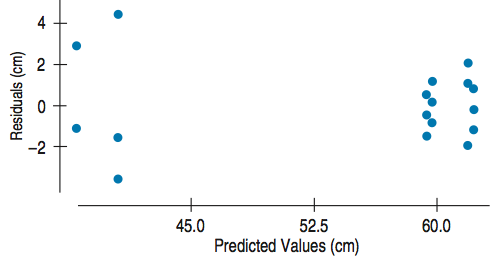
- Like the one-way ANOVA, the two-factor ANOVA requires that the variances of all treatment groups be equal. We need to check for equal spread across all treatment groups.
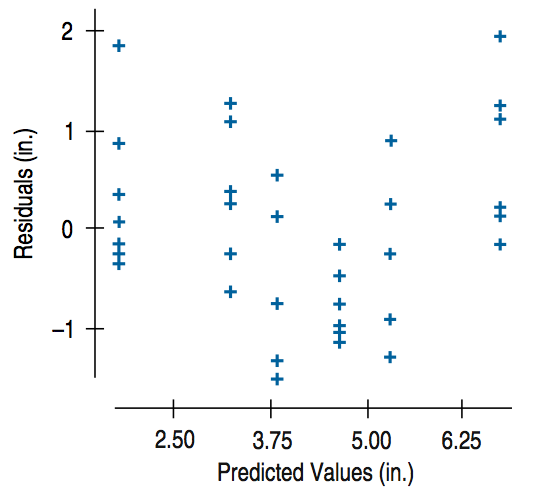
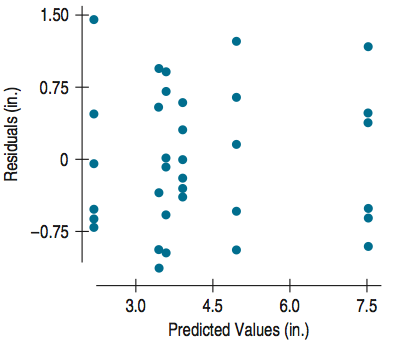
- Look at the residuals plotted against the predicted values. If the plot thickens (to one side or the other), it’s a sign that the variance is changing systematically.
- Consider re-expressing the response variable.
Assumptions and Conditions (cont)
- Scatterplot of residuals vs. predicted values from the two-way ANOVA model.
- This figure doesn’t show changing variance, but it’s certainly not patternless. It shows a U-shaped pattern. This suggests the condition is violated.
Assumptions and Conditions (cont)
You can also plot the residuals grouped by each factor.
Boxplots of the residuals from the two-way ANOVA of the dart accuracy experiment show roughly equal variability when plotted for each factor.
Assumptions and Conditions (cont)
Normal Error Assumption
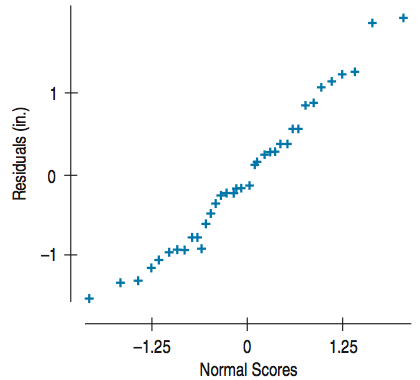
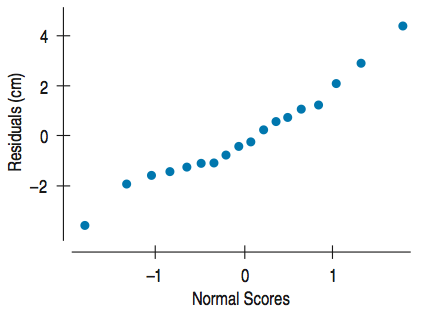
- As with one-way ANOVA, the F-tests require that the underlying errors follow a Normal model. We’ll check a corresponding Nearly Normal Condition with a Normal probability plot or histogram of the residuals.
A Normal probability plot of the residuals from the two-way ANOVA model for dart accuracy seems reasonably straight.
Example: Two-Factor Analysis of Variance
Tennis balls’ bounce – Step-by Step
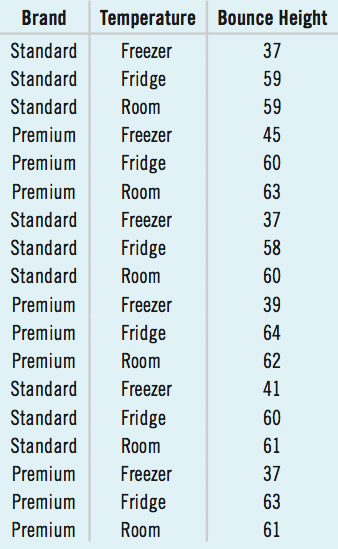
Perform a two-factor experiment on tennis balls Brand and Temperature, using two Brands of tennis balls and three levels of Temperature.
The subject bounced three balls under each of the six treatment conditions by first randomly selecting a Brand and for that ball, randomly selecting whether to leave it at room temperature or to put it in the refrigerator or the freezer. After 8 hours she dropped the balls from a height of 1 meter to a concrete floor, recording the Height of the bounce in centimeters.
Example: Two-Factor Analysis of Variance
Step-by Step
- This is a completely randomized replicated design in two factors.
- The factor Brand has two levels: Premium and Standard.
- The factor Temperature has three levels: Room, Fridge, and Freezer. The null hypotheses are that Brand has no effect and that Temperature has no effect.
Example: Two-Factor Analysis of Variance
Step-by Step
State what we want to know and the null hypotheses we wish to test.
For two-factor ANOVA, the null hypotheses are that all the treatment groups have the same mean for each factor. The alternatives are that the means are not all equal.
Example: Two-Factor Analysis of Variance
Step-by Step
Plan – Before Testing, Check Conditions.
Similar Variance Condition.
![]()
Example: Two-Factor Analysis of Variance
Step-by Step
Nearly Normal Condition, Outlier Condition.
![]()
Example: Two-Factor Analysis of Variance
Step-by Step
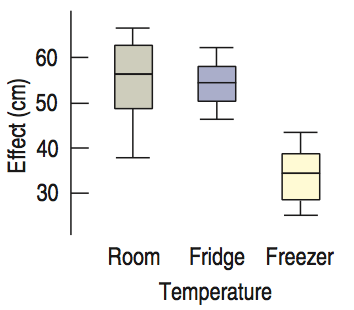
Plot – Examine the side-by-side partial boxplots of the data.
- Temperature has an effect.
- Can’t be sure about Brand from the plots.
Example: Two-Factor Analysis of Variance
Step-by Step
Plan – Think about the assumptions and check the appropriate conditions.
![]()
Example: Two-Factor Analysis of Variance
Step-by Step
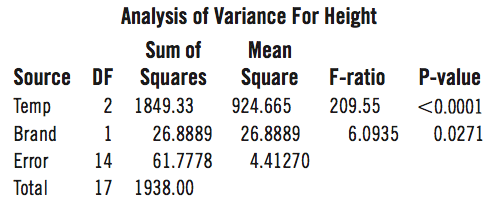
Plan – Show the ANOVA table.
![]()
Example: Two-Factor Analysis of Variance
Step-by Step
Interpretation – Tell what the F-tests mean.
F-ratios this large would be very unlikely if the factors had no effect. I conclude that the means of the two Brand levels are not equal.
Throwing darts: Interactions
Interaction plot of Accuracy by Hand and Distance. The effect of Distance appears to be greater for the left hand.
Example: Two-Factor ANOVA with Interaction
Step-By-Step
- Earlier, we looked at how much TV four groups of students watched on average.
- Let’s look at their grade point averages (GPAs).
- We treated the four groups (male athletes, female athletes, male non-athletes, and female non-athletes) as four levels of the factor Group.
- Now we recognize that there are really two factors: the factor Sex with levels male and female and the factor Varsity with levels yes and no. Let’s analyze the GPA data with a two-factor ANOVA.
Example: Two-Factor ANOVA with Interaction
Step-By-Step
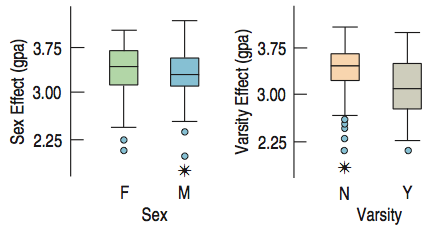
Plot – Examine the side-by-side partial boxplots of the data.
![]()
Example: Two-Factor ANOVA with Interaction
Step-By-Step
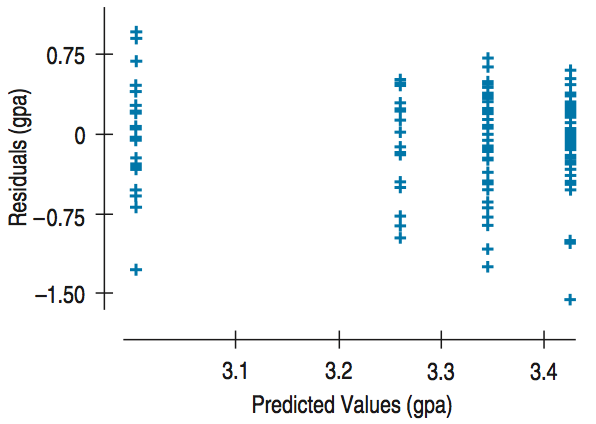
Similar Variance Condition:
no thickening, no pattern
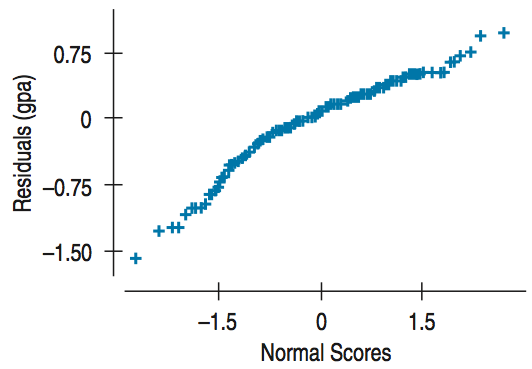
Nearly Normal Condition, Outlier Condition:
plot is reasonable
Example: Two-Factor ANOVA with Interaction
Step-By-Step
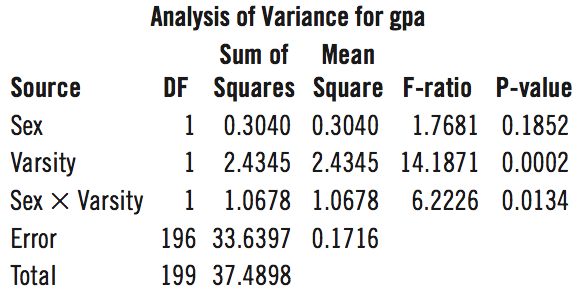
Plan – Show the ANOVA table.
![]()
Example: Two-Factor ANOVA with Interaction
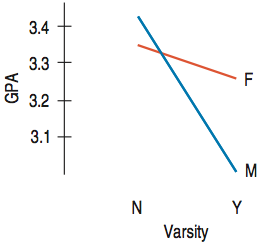
Step-By-Step
![]()
What Can Go Wrong?
Always check for outliers.
- Outliers can distort your conclusions.
Check for skewness.
- If the underlying data distributions are skewed, consider a transformation to make them more symmetric.
Beware of unbalanced designs and designs with empty cells.
- Empty cells and other more serious violations of balance require different methods and additional assumptions.
What Have We Learned?
- We can extend the Analysis of Variance to designs with more than one factor.
- Partial boxplots are a good way to examine the effect of each factor on the response.
- Sometimes factors can interact with each other and we can add an interaction term to our model to account for the possible interaction.
- We need to check the appropriate assumptions and conditions as we did for the simple ANOVA.